Statistics is the study of variability. Students who understand statistics need to …
Statistics is the study of variability. Students who understand statistics need to be able to identify and pose questions that can be answered by data that vary. The purpose of this task is to provide questions related to a particular context (a jar of buttons) so that students can identify which are statistical questions. The task also provides students with an opportunity to write a statistical question that pertains to the context.
This is an Internet-based probability and statistics E-Book. The materials, tools and …
This is an Internet-based probability and statistics E-Book. The materials, tools and demonstrations presented in this E-Book would be very useful for advanced-placement (AP) statistics educational curriculum. The E-Book is initially developed by the UCLA Statistics Online Computational Resource (SOCR). However, all statistics instructors, researchers and educators are encouraged to contribute to this project and improve the content of these learning materials. There are 4 novel features of this specific Statistics EBook. It is community-built, completely open-access (in terms of use and contributions), blends information technology, scientific techniques and modern pedagogical concepts, and is multilingual.
This is a task from the Illustrative Mathematics website that is one …
This is a task from the Illustrative Mathematics website that is one part of a complete illustration of the standard to which it is aligned. Each task has at least one solution and some commentary that addresses important aspects of the task and its potential use.
Students will explore the overarching question, is the internet trustworthy?, while expanding …
Students will explore the overarching question, is the internet trustworthy?, while expanding their knowledge of statistics and comparing data sets. They will compare two data sets as well as determine the accuracy or bias of data representations shown on the internet. Students will then have the opportunity to apply their knowledge while creating their own visual representations for data they personally collected regarding the trustworthiness of the internet. The module concludes with a peer showcase and the post-assessment.
Students write statistical questions that can be used to find information about …
Students write statistical questions that can be used to find information about a typical sixth grade student. Then, the class works together to informally plan how to find the typical arm span of a student in their class.Key ConceptsStatistical thinking, in large part, must deal with variability; statistical problem solving and decision making depend on understanding, explaining, and quantifying the variability in the data.“How tall is a sixth grader?” is a statistical question because all sixth graders are not the same height—there is variability.Goals and Learning ObjectivesUnderstand what a statistical question is.Realize there is variability in data and understand why.Describe informally the range, median, and mode of a set of data.
Students apply pre-requisite statistics knowledge and concepts learned in an associated lesson …
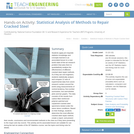
Students apply pre-requisite statistics knowledge and concepts learned in an associated lesson to a real-world state-of-the-art research problem that asks them to quantitatively analyze the effectiveness of different cracked steel repair methods. As if they are civil engineers, students statistically analyze and compare 12 sets of experimental data from seven research centers around the world using measurements of central tendency, five-number summaries, box-and-whisker plots and bar graphs. The data consists of the results from carbon-fiber-reinforced polymer patched and unpatched cracked steel specimens tested under the same stress conditions. Based on their findings, students determine the most effective cracked steel repair method, create a report, and present their results, conclusions and recommended methods to the class as if they were presenting to the mayor and city council. This activity and its associated lesson are suitable for use during the last six weeks of the AP Statistics course; see the topics and timing note for details.
This lesson unit is intended to help teachers assess how well students …
This lesson unit is intended to help teachers assess how well students are able to: interpret data and evaluate statistical summaries; and critique someone elseŐs interpretations of data and evaluations of statistical summaries. The lesson also introduces students to the dangers of misapplying simple statistics in real-world contexts, and illustrates some of the common abuses of statistics and charts found in the media.
This is a task from the Illustrative Mathematics website that is one …
This is a task from the Illustrative Mathematics website that is one part of a complete illustration of the standard to which it is aligned. Each task has at least one solution and some commentary that addresses important asects of the task and its potential use. Here are the first few lines of the commentary for this task: Which of the following are statistical questions? (A statistical question is one that can be answered by collecting data and where there will be variab...
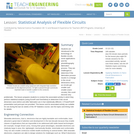
Students are introduced to the technology of flexible circuits, some applications and …
Students are introduced to the technology of flexible circuits, some applications and the photolithography fabrication process. They are challenged to determine if the fabrication process results in a change in the circuit dimensions since, as circuits get smaller and smaller (nano-circuits), this could become very problematic. The lesson prepares students to conduct the associated activity in which they perform statistical analysis (using Excel® and GeoGebra) to determine if the circuit dimension sizes before and after fabrication are in fact statistically different. A PowerPoint® presentation and post-quiz are provided. This lesson and its associated activity are suitable for use during the last six weeks of the AP Statistics course; see the topics and timing note for details.
In this module, students reconnect with and deepen their understanding of statistics …
In this module, students reconnect with and deepen their understanding of statistics and probability concepts first introduced in Grades 6, 7, and 8. Students develop a set of tools for understanding and interpreting variability in data, and begin to make more informed decisions from data. They work with data distributions of various shapes, centers, and spreads. Students build on their experience with bivariate quantitative data from Grade 8. This module sets the stage for more extensive work with sampling and inference in later grades.
Find the rest of the EngageNY Mathematics resources at https://archive.org/details/engageny-mathematics.
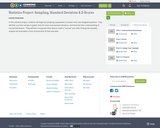
In this statistics project, students will begin by sampling a population to …
In this statistics project, students will begin by sampling a population to answer their own designed question. They will then use their sample to graph, find the mean and standard deviation, and illustrate their understanding of normal distribution. They will then manipulate their data to make it "normal" and, after finding new samples, analyze the associated z-score and percents of that new data.
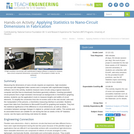
Measuring the dimensions of nano-circuits requires an expensive, high-resolution microscope with integrated …
Measuring the dimensions of nano-circuits requires an expensive, high-resolution microscope with integrated video camera and a computer with sophisticated imaging software, but in this activity, students measure nano-circuits using a typical classroom computer and (the free-to-download) GeoGebra geometry software. Inserting (provided) circuit pictures from a high-resolution microscope as backgrounds in GeoGebra's graphing window, students use the application's tools to measure lengths and widths of circuit elements. To simplify the conversion from the on-screen units to the real circuits' units and the manipulation of the pictures, a GeoGebra measuring interface is provided. Students export their data from GeoGebra to Microsoft® Excel® for graphing and analysis. They test the statistical significance of the difference in circuit dimensions, as well as obtain a correlation between average changes in original vs. printed circuits' widths. This activity and its associated lesson are suitable for use during the last six weeks of the AP Statistics course; see the topics and timing note below for details.
This is a text-based STEM Inquiry, focusing on the mathematical standard of …
This is a text-based STEM Inquiry, focusing on the mathematical standard of making inferences and justifying conclusions while evaluating reports based on data. The unit culminates in students presenting their findings comparing local to national data regarding the relationships between educational attainment and financial earnings.
This applet from Statistical Java allows the user to generate bivariate data …
This applet from Statistical Java allows the user to generate bivariate data for analysis with simple linear regression. The page describes the equations used to generate the data and estimate the regression lines.
The students will use ACC basketball statistics to practice the process of …
The students will use ACC basketball statistics to practice the process of converting fractions to decimals then to percents and will learn how to create and edit a spreadsheet. They will then use this spreadsheet to analyze their data. This unit is done during the basketball season which takes approximately 15 weeks from the middle of November to the middle of March. Teachers must have Clarisworks to open the sample spreadsheet in the lesson, but may recreate it in another spreadsheet program.
This task introduces the fundamental statistical ideas of using data summaries (statistics) …
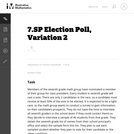
This task introduces the fundamental statistical ideas of using data summaries (statistics) from random samples to draw inferences (reasoned conclusions) about population characteristics (parameters). In the task built around an election poll scenario, the population is the entire seventh grade class, the unknown characteristic (parameter) of interest is the proportion of the class members voting for a specific candidate, and the sample summary (statistic) is the observed proportion of voters favoring the candidate in a random sample of class members.
This task introduces the fundamental statistical ideas of using data summaries (statistics) …
This task introduces the fundamental statistical ideas of using data summaries (statistics) from random samples to draw inferences (reasoned conclusions) about population characteristics (parameters). In the task built around an election poll scenario, the population is the entire seventh grade class, the unknown characteristic (parameter) of interest is the proportion of the class members voting for a specific candidate, and the sample summary (statistic) is the observed proportion of voters favoring the candidate in a random sample of class members.
A full AP® Statistics curriculum that explores relevant data in social issues, …
A full AP® Statistics curriculum that explores relevant data in social issues, economics, medicine, sports, and more. The sequence works well in conjunction with the course CED and the most widely-used AP® Statistics textbooks.
Lesson OverviewStudents complete a card sort that requires them to match sets …
Lesson OverviewStudents complete a card sort that requires them to match sets of statistics with the corresponding line plots.Students match cards with simple line plots to the corresponding card with measures of center. Some cards include mode, mean, median, and range, and some have one or two measures missing. Students discuss how they determined which cards would match.Key ConceptsTo complete the card sort in this lesson efficiently, students must be able to relate statistical measures with line plots. If they start with the measures that are easy to see, they can narrow down the possible matches.The mode is the easiest measure to see immediately. It is simply the number with the tallest column of dots.The range can be found easily by subtracting the least value in the plot from the greatest.The median can be found fairly quickly by counting to the middle dot or by pairing dots on the ends until reaching the middle.The mean must be calculated by adding data values and dividing.Goals and Learning ObjectivesApply knowledge of measures of center and range to solve problems.Discuss and review strategy choices when problem solving.
This is a task from the Illustrative Mathematics website that is one …
This is a task from the Illustrative Mathematics website that is one part of a complete illustration of the standard to which it is aligned. Each task has at least one solution and some commentary that addresses important aspects of the task and its potential use.
This task examines, from a mathematical and statistical point of view, how …
This task examines, from a mathematical and statistical point of view, how scientists measure the age of organic materials by measuring the ratio of Carbon 14 to Carbon 12. The focus here is on the statistical nature of such dating. This task addresses a very important issue about precision in reporting and understanding statements in a realistic scientific context.
This is a task from the Illustrative Mathematics website that is one …
This is a task from the Illustrative Mathematics website that is one part of a complete illustration of the standard to which it is aligned. Each task has at least one solution and some commentary that addresses important aspects of the task and its potential use.
No restrictions on your remixing, redistributing, or making derivative works. Give credit to the author, as required.
Your remixing, redistributing, or making derivatives works comes with some restrictions, including how it is shared.
Your redistributing comes with some restrictions. Do not remix or make derivative works.
Most restrictive license type. Prohibits most uses, sharing, and any changes.
Copyrighted materials, available under Fair Use and the TEACH Act for US-based educators, or other custom arrangements. Go to the resource provider to see their individual restrictions.