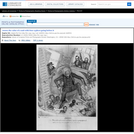
A satire on dissension and political intrigue within Andrew Jackson's administration, surrounding …
A satire on dissension and political intrigue within Andrew Jackson's administration, surrounding the Spring 1831 resignations of several members of his Cabinet. In the center Jackson sits in a collapsing chair, labeled "The Hickory Chair is coming to pieces at last." Seated on the arm of his chair is a rat with the head of Postmaster General William T. Barry. On the floor before him is a pile of resignations with a broken clay pipe, and a brazier. He sweeps with a broom at a number of rats scurrying at his feet, and in the act knocks over the "Altar of Reform" toppling a winged ass also holding a broom. The rats have heads of (from left to right) Secretary of State Martin Van Buren, Secretary of War John H.Eaton, "D. I. O."(?), Navy Secretary John Branch, and Treasury Secretary Samuel D. Ingham. John Calhoun is a terrier which menaces the Van Buren rat. Van Buren, threatened by an eagle while attempting to climb the "Ladder of Political Preferment" whose rungs are labeled with the names of the states, says, "If I could only humbug that Eagle and climb up this ladder." Calhoun: "You don't get up if I can help it." Eaton: "I'm off to the Indians." Branch: "This from the greatest and best of men." Ingham: "Is this the reward of my Patriotic disinterestedness." In a doorway marked "Skool of Reform" appears a man in a visored cap and fur-trimmed coat saying, "There's Clay, and this is all Clays doings." Daniel Webster and Henry Clay (with raised arms) look in through a window. Webster: "That Terrier has nullified the whole Concern." Clay: "Famine! War! Pestilence!"|Cock of the Walk fecit. (Edward Williams Clay).|Entered . . . 1831 by E.W. Clay.|Publd by E.W. Clay, S.E. corner of Walnut and 4th St. Philada.|The print appears to have been derived from William James Hubbard's portrait of Jackson, or from Albert Newsam's 1830 lithograph reproducing the painting. A pencil sketch believed by Davison to be Clay's sketch for the print is in the National Portrait Gallery in Washington. The Library's impression of ".0001" was deposited for copyright on May 5, 1831. Davison also lists a second edition of the print. Two anonymous versions of the print, possibly derived from ".00001," were published under the title "The Rats leaving a falling house." (See 1831-2).|Title appears as it is written on the item.|Davison, no. 32 (sketch), 56 and 57.|Murrell, p. 109-110.|Weitenkampf, p. 24.|Forms part of: American cartoon print filing series (Library of Congress)|Published in: American political prints, 1766-1876 / Bernard F. Reilly. Boston : G.K. Hall, 1991, entry 1831-1.
Esta história é um produto didático de Educação Ambiental não formal, resultado …
Esta história é um produto didático de Educação Ambiental não formal, resultado da pesquisa de dissertação do Programa de Ciências Ambientais/UFPA na busca para diversos problemas ambientais de ação antrópica utilizando de forma lúdica para: conhecer, pertencer, proteger e conservar o " Parque Estadual do Utinga Camilo Vianna" localizado Belém e Ananindeua para presente e futura gerações.
These lesson plans and activities were developed by Janine Darragh, Gina Petrie, …
These lesson plans and activities were developed by Janine Darragh, Gina Petrie, and Stan Pichinevskiy and were previously located on the Reaching for English app. Created for K-12 English teachers in Nicaragua, the materials may be used and adapted for any country's specific context and needs.
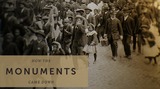
BEGIN HERE: How the Monuments Came Down Series and Curriculum Guide introduction: …
BEGIN HERE: How the Monuments Came Down Series and Curriculum Guide introduction: Introductory information about the series and curriculum guides, along with a linked list of the episodes in order.Note: This item and the collection it belongs to was imported with permission from #GoOpenVA. While the content is the same, the original location can be found here.
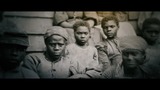
Learn how enslaved African Americans in Richmond, Virginia, established what a historian …
Learn how enslaved African Americans in Richmond, Virginia, established what a historian in this clip calls “quasi-free communities, where they etched out lives for themselves, that paved the way forward.” This resource is part of the How the Monuments Came Down collection, created by Virginia Public Media.
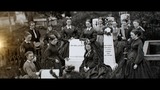
Discover the differing approaches to memorialization among African Americans and white southerners, …
Discover the differing approaches to memorialization among African Americans and white southerners, in Richmond, Virginia, in the years immediately after the Civil War. This resource is part of the How the Monuments Came Down collection.
Nachdem ich einige fortgeschrittene Videos gemacht habe, fülle ich nun die Lücke …
Nachdem ich einige fortgeschrittene Videos gemacht habe, fülle ich nun die Lücke am Anfang :) Hier geht es um Variablen und was man damit so machen kann :)
Discover how African American political organizing in Richmond, Virginia, in the first …
Discover how African American political organizing in Richmond, Virginia, in the first decades after the Civil War, secured a measure of power amid ongoing fights against injustice.
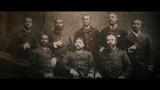
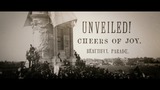
Discover how white southerners in Richmond, Virginia, honored General Robert E. Lee …
Discover how white southerners in Richmond, Virginia, honored General Robert E. Lee through a monument of his likeness unveiled in the former Confederate capital in 1890.
Discover John Mitchell, Jr. and Maggie L Walker, two African American leaders …
Discover John Mitchell, Jr. and Maggie L Walker, two African American leaders in Richmond, Virginia, whom a historian in this clip refers to as “the vanguard” of Black resistance to white supremacy there.
Learn why white city leaders in Richmond, Virginia, in the early 20th …
Learn why white city leaders in Richmond, Virginia, in the early 20th century, embraced the nationwide “City Beautiful” movement through the construction of Monument Avenue, a grand boulevard lined with statues to Confederates.
Learn why blackface minstrelsy in the early 20th century sought to “parody …
Learn why blackface minstrelsy in the early 20th century sought to “parody and caricature Black ambition and achievement,” as explained by historians in this clip. Note to Teachers: The video clip, Caricatures of African Americans, includes depictions of blackface; in an effort to provide authentic and transparent resources about the historical experiences of Black Americans, these moments were not censored.
Learn about Jackson Ward, a historic African American neighborhood in Richmond, Virginia, …
Learn about Jackson Ward, a historic African American neighborhood in Richmond, Virginia, and why white city leaders supported the construction of an interstate highway through its center in the 1950s.
No restrictions on your remixing, redistributing, or making derivative works. Give credit to the author, as required.
Your remixing, redistributing, or making derivatives works comes with some restrictions, including how it is shared.
Your redistributing comes with some restrictions. Do not remix or make derivative works.
Most restrictive license type. Prohibits most uses, sharing, and any changes.
Copyrighted materials, available under Fair Use and the TEACH Act for US-based educators, or other custom arrangements. Go to the resource provider to see their individual restrictions.