This task addresses many standards regarding the description and analysis of bivariate …
This task addresses many standards regarding the description and analysis of bivariate quantitative data, including regression and correlation. Students should recognize that the pattern shown is one of a strong, positive, linear association, and thus a correlation coefficient value near +1 is plausible. Students should also be able to interpret the slope of the least-squares line as an estimated increase in y per unit change in x (and thus for a 3 unit increase in x, students should expect an estimated increase in y that equals 3 times the model's slope value).
A full AP® Statistics curriculum that explores relevant data in social issues, …
A full AP® Statistics curriculum that explores relevant data in social issues, economics, medicine, sports, and more. The sequence works well in conjunction with the course CED and the most widely-used AP® Statistics textbooks.
In this module, students reconnect with and deepen their understanding of statistics …
In this module, students reconnect with and deepen their understanding of statistics and probability concepts first introduced in Grades 6, 7, and 8. Students develop a set of tools for understanding and interpreting variability in data, and begin to make more informed decisions from data. They work with data distributions of various shapes, centers, and spreads. Students build on their experience with bivariate quantitative data from Grade 8. This module sets the stage for more extensive work with sampling and inference in later grades.
Find the rest of the EngageNY Mathematics resources at https://archive.org/details/engageny-mathematics.
This lesson unit is intended to help teachers assess how well students …
This lesson unit is intended to help teachers assess how well students understand the notion of correlation. In particular this unit aims to identify and help students who have difficulty in: understanding correlation as the degree of fit between two variables; making a mathematical model of a situation; testing and improving the model; communicating their reasoning clearly; and evaluating alternative models of the situation.
This is a simple task addressing the distinction between correlation and causation. …
This is a simple task addressing the distinction between correlation and causation. Students are given information indicating a correlation between two variables, and are asked to reason out whether or not a causation can be inferred. The task would be well-suited either as an introduction to this distinction, or as an assessment item.
The purpose of this task is to assess understanding of how study …
The purpose of this task is to assess understanding of how study design dictates whether a conclusion of causation is warranted. This study was observational and not an experiment, which means that it is not possible to reach a cause-and-effect conclusion.
This lesson unit is intended to help teachers assess how well students …
This lesson unit is intended to help teachers assess how well students are able to: interpret data and evaluate statistical summaries; and critique someone elseŐs interpretations of data and evaluations of statistical summaries. The lesson also introduces students to the dangers of misapplying simple statistics in real-world contexts, and illustrates some of the common abuses of statistics and charts found in the media.
The goal of this task is twofold. For part (a) since we …
The goal of this task is twofold. For part (a) since we are not given how large each of the groups in the table are, the best we can do is to apply reasoning about ratios (in the form of percents) to give a range of possible answers. For part (b), the goal is to recognize a misuse of statistical reasoning.
The intent of clarifying statements is to provide additional guidance for educators …
The intent of clarifying statements is to provide additional guidance for educators to communicate the intent of the standard to support the future development of curricular resources and assessments aligned to the 2021 math standards. Clarifying statements can be in the form of succinct sentences or paragraphs that attend to one of four types of clarifications: (1) Student Experiences; (2) Examples; (3) Boundaries; and (4) Connection to Math Practices.
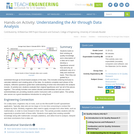
Students build on their existing air quality knowledge and a description of …
Students build on their existing air quality knowledge and a description of a data set to each develop a hypothesis around how and why air pollutants vary on a daily and seasonal basis. Then they are guided by a worksheet through an Excel-based analysis of the data. This includes entering formulas to calculate statistics and creating plots of the data. As students complete each phase of the analysis, reflection questions guide their understanding of what new information the analysis reveals. At activity end, students evaluate their original hypotheses and “put all of the pieces together.” The activity includes one carbon dioxide worksheet/data set and one ozone worksheet/data set; providing students and/or instructors with a content option. The activity also serves as a good standalone introduction to using Excel.
(Nota: Esta es una traducción de un recurso educativo abierto creado por …
(Nota: Esta es una traducción de un recurso educativo abierto creado por el Departamento de Educación del Estado de Nueva York (NYSED) como parte del proyecto "EngageNY" en 2013. Aunque el recurso real fue traducido por personas, la siguiente descripción se tradujo del inglés original usando Google Translate para ayudar a los usuarios potenciales a decidir si se adapta a sus necesidades y puede contener errores gramaticales o lingüísticos. La descripción original en inglés también se proporciona a continuación.)
En este módulo, los estudiantes reconectan y profundizan su comprensión de las estadísticas y los conceptos de probabilidad introducidos por primera vez en los grados 6, 7 y 8. Los estudiantes desarrollan un conjunto de herramientas para comprender e interpretar la variabilidad en los datos, y comienzan a tomar decisiones más informadas de los datos . Trabajan con distribuciones de datos de varias formas, centros y diferenciales. Los estudiantes se basan en su experiencia con datos cuantitativos bivariados del grado 8. Este módulo prepara el escenario para un trabajo más extenso con muestreo e inferencia en calificaciones posteriores.
Encuentre el resto de los recursos matemáticos de Engageny en https://archive.org/details/engageny-mathematics.
English Description: In this module, students reconnect with and deepen their understanding of statistics and probability concepts first introduced in Grades 6, 7, and 8. Students develop a set of tools for understanding and interpreting variability in data, and begin to make more informed decisions from data. They work with data distributions of various shapes, centers, and spreads. Students build on their experience with bivariate quantitative data from Grade 8. This module sets the stage for more extensive work with sampling and inference in later grades.
Find the rest of the EngageNY Mathematics resources at https://archive.org/details/engageny-mathematics.
No restrictions on your remixing, redistributing, or making derivative works. Give credit to the author, as required.
Your remixing, redistributing, or making derivatives works comes with some restrictions, including how it is shared.
Your redistributing comes with some restrictions. Do not remix or make derivative works.
Most restrictive license type. Prohibits most uses, sharing, and any changes.
Copyrighted materials, available under Fair Use and the TEACH Act for US-based educators, or other custom arrangements. Go to the resource provider to see their individual restrictions.