A full AP® Statistics curriculum that explores relevant data in social issues, …
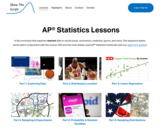
A full AP® Statistics curriculum that explores relevant data in social issues, economics, medicine, sports, and more. The sequence works well in conjunction with the course CED and the most widely-used AP® Statistics textbooks.
Students build a formal understanding of probability, considering complex events such as …
Students build a formal understanding of probability, considering complex events such as unions, intersections, and complements as well as the concept of independence and conditional probability. The idea of using a smooth curve to model a data distribution is introduced along with using tables and technology to find areas under a normal curve. Students make inferences and justify conclusions from sample surveys, experiments, and observational studies. Data is used from random samples to estimate a population mean or proportion. Students calculate margin of error and interpret it in context. Given data from a statistical experiment, students use simulation to create a randomization distribution and use it to determine if there is a significant difference between two treatments.
Find the rest of the EngageNY Mathematics resources at https://archive.org/details/engageny-mathematics.
(Nota: Esta es una traducción de un recurso educativo abierto creado por …
(Nota: Esta es una traducción de un recurso educativo abierto creado por el Departamento de Educación del Estado de Nueva York (NYSED) como parte del proyecto "EngageNY" en 2013. Aunque el recurso real fue traducido por personas, la siguiente descripción se tradujo del inglés original usando Google Translate para ayudar a los usuarios potenciales a decidir si se adapta a sus necesidades y puede contener errores gramaticales o lingüísticos. La descripción original en inglés también se proporciona a continuación.)
Los estudiantes crean una comprensión formal de la probabilidad, considerando eventos complejos como sindicatos, intersecciones y complementos, así como el concepto de independencia y probabilidad condicional. La idea de usar una curva suave para modelar una distribución de datos se introduce junto con el uso de tablas y tecnología para encontrar áreas bajo una curva normal. Los estudiantes hacen inferencias y justifican conclusiones de encuestas de muestra, experimentos y estudios de observación. Los datos se usan de muestras aleatorias para estimar una media o proporción de población. Los estudiantes calculan el margen de error y lo interpretan en contexto. Dados los datos de un experimento estadístico, los estudiantes usan la simulación para crear una distribución de aleatorización y lo usan para determinar si hay una diferencia significativa entre dos tratamientos.
Encuentre el resto de los recursos matemáticos de Engageny en https://archive.org/details/engageny-mathematics.
English Description: Students build a formal understanding of probability, considering complex events such as unions, intersections, and complements as well as the concept of independence and conditional probability. The idea of using a smooth curve to model a data distribution is introduced along with using tables and technology to find areas under a normal curve. Students make inferences and justify conclusions from sample surveys, experiments, and observational studies. Data is used from random samples to estimate a population mean or proportion. Students calculate margin of error and interpret it in context. Given data from a statistical experiment, students use simulation to create a randomization distribution and use it to determine if there is a significant difference between two treatments.
Find the rest of the EngageNY Mathematics resources at https://archive.org/details/engageny-mathematics.
At its core, the LEGO MINDSTORMS(TM) NXT product provides a programmable microprocessor. …
At its core, the LEGO MINDSTORMS(TM) NXT product provides a programmable microprocessor. Students use the NXT processor to simulate an experiment involving thousands of uniformly random points placed within a unit square. Using the underlying geometry of the experimental model, as well as the geometric definition of the constant π (pi), students form an empirical ratio of areas to estimate a numerical value of π. Although typically used for numerical integration of irregular shapes, in this activity, students use a Monte Carlo simulation to estimate a common but rather complex analytical form the numerical value of the most famous irrational number, π.
This lesson unit is intended to help teachers assess how well students …
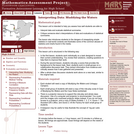
This lesson unit is intended to help teachers assess how well students are able to: interpret data and evaluate statistical summaries; and critique someone elseŐs interpretations of data and evaluations of statistical summaries. The lesson also introduces students to the dangers of misapplying simple statistics in real-world contexts, and illustrates some of the common abuses of statistics and charts found in the media.
The intent of clarifying statements is to provide additional guidance for educators …
The intent of clarifying statements is to provide additional guidance for educators to communicate the intent of the standard to support the future development of curricular resources and assessments aligned to the 2021 math standards. Clarifying statements can be in the form of succinct sentences or paragraphs that attend to one of four types of clarifications: (1) Student Experiences; (2) Examples; (3) Boundaries; and (4) Connection to Math Practices.
This is a task from the Illustrative Mathematics website that is one …
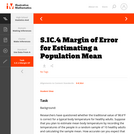
This is a task from the Illustrative Mathematics website that is one part of a complete illustration of the standard to which it is aligned. Each task has at least one solution and some commentary that addresses important aspects of the task and its potential use.
This is a task from the Illustrative Mathematics website that is one …
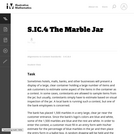
This is a task from the Illustrative Mathematics website that is one part of a complete illustration of the standard to which it is aligned. Each task has at least one solution and some commentary that addresses important asects of the task and its potential use. Here are the first few lines of the commentary for this task: Sometimes hotels, malls, banks, and other businesses will present a display of a large, clear container holding a large number of items and ask custome...
This is a task from the Illustrative Mathematics website that is one …
This is a task from the Illustrative Mathematics website that is one part of a complete illustration of the standard to which it is aligned. Each task has at least one solution and some commentary that addresses important aspects of the task and its potential use.
In this statistics project, students will begin by sampling a population to …
In this statistics project, students will begin by sampling a population to answer their own designed question. They will then use their sample to graph, find the mean and standard deviation, and illustrate their understanding of normal distribution. They will then manipulate their data to make it "normal" and, after finding new samples, analyze the associated z-score and percents of that new data.
No restrictions on your remixing, redistributing, or making derivative works. Give credit to the author, as required.
Your remixing, redistributing, or making derivatives works comes with some restrictions, including how it is shared.
Your redistributing comes with some restrictions. Do not remix or make derivative works.
Most restrictive license type. Prohibits most uses, sharing, and any changes.
Copyrighted materials, available under Fair Use and the TEACH Act for US-based educators, or other custom arrangements. Go to the resource provider to see their individual restrictions.