Students write the relationship between two fractions as a unit rate and …
Students write the relationship between two fractions as a unit rate and use unit rates and the constant of proportionality to solve problems involving proportional relationships.Key ConceptsIn situations where there is a constant rate involved, the unit rate is a constant of proportionality between the two variable quantities and can be used to write a formula of the form y = kx.A given constant rate can be simplified to find the unit rate by expressing its value with a denominator of 1.The ratios of two fractions can be expressed as a unit rate.Goals and Learning ObjectivesExpress the ratios of two fractions as a unit rate.Understand that when a constant rate is involved, the unit rate is the constant of proportionality.Use the unit rate to write and solve a formula of the form y = kx.
Students look at the relationship between the number of flags manufactured and …
Students look at the relationship between the number of flags manufactured and the stars on the flag and determine whether it represents a proportional relationship.Key ConceptsThe form of the equation of a proportional relation is y = kx, where k is the constant of proportionality.A graph of a proportional relationship is a straight line that passes through the origin.The constant of a proportionality in a graph of a proportional relationship is the constant ratio of y to x (the slope of the line).Goals and Learning ObjectivesIdentify the constant of proportionality in a proportional relationship based on a real-world problem situation.Write a formula using the constant of proportionality.Analyze a graph of a proportional relationship.Make a graph and determine if it represents a proportional relationship.Identify the constant of proportionality in a graph of a proportional relationship.
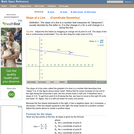
Students explore the idea that not all straight lines are proportional by …
Students explore the idea that not all straight lines are proportional by comparing a graph representing a stack of books with a graph representing a stack of cups. They recognize that all proportional relationships are represented as a straight line that passes through the origin.Key ConceptsNot all graphs of straight lines represent proportional relationships.There are three ways to tell whether a relationship between two varying quantities is proportional:The graph of the relationship between the quantities is a straight line that passes through the point (0, 0).You can express one quantity in terms of the other using a formula of the form y = kx.The ratios between the varying quantities are constant.Goals and Learning ObjectivesUnderstand when a graph of a straight line is and when it is not a proportional relationship.Recognize that a proportional relationship is shown on a graph as a straight line that passes through the origin (0, 0).Make a table of values to represent two quantities that vary.Graph a table of values representing two quantities that vary.Describe what each variable and number in a formula represents.
Students represent and solve percent decrease problems.Key ConceptsWhen there is a percent …
Students represent and solve percent decrease problems.Key ConceptsWhen there is a percent decrease between a starting amount and a final amount, the relationship can be represented by an equation of the form y = kx where y is the final amount, x is the starting amount, and k is the constant of proportionality, which is equal to 1 minus the percent change, p, represented as a decimal: k = 1 – p, so y = (1 – p)x.The constant of proportionality k has the value it does—a number less than 1—because of the way the distributive property can be used to simplify the expression for the starting amount decreased by a percent of the starting amount: x – x(p) = x(1 – p).Goals and Learning ObjectivesDetermine the unknown amount—either the starting amount, the percent change, or the final amount—in a percent decrease situation when given the other two amounts.Make a table to represent a percent decrease problem.Write and solve an equation to represent a percent decrease problem.
Students represent and solve percent increase problems.Key ConceptsWhen there is a percent …
Students represent and solve percent increase problems.Key ConceptsWhen there is a percent increase between a starting amount and a final amount, the relationship can be represented by an equation of the form y = kx where y is the final amount, x is the starting amount, and k is the constant of proportionality, which is equal to 1 plus the percent change, p, represented as a decimal: k = 1 + p, so y = (1 + p)x.The constant of proportionality k has the value it does—a number greater than 1—because of the way the distributive property can be used to simplify the expression for the starting amount increased by a percent of the starting amount: x + x(p) = x(1 + p).Goals and Learning ObjectivesDetermine the unknown amount—either the starting amount, the percent change, or the final amount—in a percent increase situation when given the other two amounts.Make a table to represent a percent increase problem.Write and solve an equation to represent a percent increase problem.
Students continue to explore the three relationships from the previous lessons: Comparing …
Students continue to explore the three relationships from the previous lessons: Comparing Dimensions, Driving to the Amusement Park, and Temperatures at the Amusement Park. They graph the three situations and realize that the two proportional relationships form a straight line, but the time and temperature relationship does not.Key ConceptsA table of values that represent equivalent ratios can be graphed in the coordinate plane. The graph represents a proportional relationship in the form of a straight line that passes through the origin (0, 0). The unit rate is the slope of the line.Goals and Learning ObjectivesRepresent relationships shown in a table of values as a graph.Recognize that a proportional relationship is shown on a graph as a straight line that passes through the origin (0, 0).
Students have an opportunity to review their own work on the Self …
Students have an opportunity to review their own work on the Self Check in the previous lesson, consider feedback that addresses specific aspects of their work, examine a different approach to the problem from the Self Check, and then use what they learned to solve a closely related problem.Key ConceptsStudents reflect on their work, review and critique student work on the same problem, and then apply their learning to solve a similar problem.Goals and Learning ObjectivesUse teacher comments to refine their solution strategies for a proportional relationship problemDeepen their understanding of proportional relationships.Synthesize and connect strategies for representing and investigating proportional relationships.Critique given student work involving proportional relationships.Apply deepened understanding of proportional relationships to a new problem situation.
Students watch a video showing three different ways to solve a problem …
Students watch a video showing three different ways to solve a problem involving a proportional relationship, and then they use each method to solve a similar problem. Students describe each approach, including the mathematical terms associated with each.Key ConceptsThree methods for solving problems involving proportional relationships include:Setting up a proportion and solving for the missing valueFinding the unit rate and multiplyingWriting and solving a formula using the constant of proportionalityGoals and Learning ObjectivesSolve a problem involving a proportional relationship in three different ways: set up a proportion and solve for a missing value, use a unit rate, and use the constant of proportionality to write and solve a formula.
This lesson unit is intended to help teachers assess whether students are …
This lesson unit is intended to help teachers assess whether students are able to: identify when two quantities vary in direct proportion to each other; distinguish between direct proportion and other functional relationships; and solve proportionality problems using efficient methods.
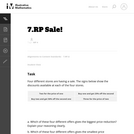
The purpose of this task is to engage students in Standard for …
The purpose of this task is to engage students in Standard for Mathematical Practice 4, Model with mathematics and as such, the question as it is worded cannot be answered without making some assumptions. For example, if the items that are purchased do not have the same value, then the price reduction depends on the cost of the items.
Students will analyze ratios and use proportions to solve problems using a …
Students will analyze ratios and use proportions to solve problems using a cooperative, kinesthetic activity in which they will create “human ratios.” Students will apply proportional reasoning to demonstrate application of a multiplicative situation by using cross products to solving proportions.
An interactive applet and associated web page that demonstrate the slope (m) …
An interactive applet and associated web page that demonstrate the slope (m) of a line. The applet has two points that define a line. As the user drags either point it continuously recalculates the slope. The rise and run are drawn to show the two elements used in the calculation. The grid, axis pointers and coordinates can be turned on and off. The slope calculation can be turned off to permit class exercises and then turned back on the verify the answers. The applet can be printed as it appears on the screen to make handouts. The web page has a full description of the concept of slope, a worked example and has links to other pages relating to coordinate geometry. Applet can be enlarged to full screen size for use with a classroom projector. This resource is a component of the Math Open Reference Interactive Geometry textbook project at http://www.mathopenref.com.
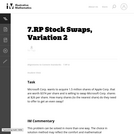
This is a multi-step problem since it requires more than two steps …
This is a multi-step problem since it requires more than two steps no matter how it is solved. The problem is not scaffolded for the student, but each step is straightforward and should follow from the previous with a careful reading of the problem.
Parts (a) and (b) of the task ask students to find the …
Parts (a) and (b) of the task ask students to find the unit rates that one can compute in this context. Part (b) does not specify whether the units should be laps or km, so answers can be expressed using either one.
سيقوم الطلاب بتحليل النسب وسيستخدمون النسب لحل المسائل بواسطة نشاط تعاوني وحركي …
سيقوم الطلاب بتحليل النسب وسيستخدمون النسب لحل المسائل بواسطة نشاط تعاوني وحركي والذي فيه سينشئون "نسبًا بشرية". سيطبق الطلاب المنطق النسبي لتمثيل تطبيق حالة تضاعفية باستخدام الضرب التبادلي لحل النسب.
No restrictions on your remixing, redistributing, or making derivative works. Give credit to the author, as required.
Your remixing, redistributing, or making derivatives works comes with some restrictions, including how it is shared.
Your redistributing comes with some restrictions. Do not remix or make derivative works.
Most restrictive license type. Prohibits most uses, sharing, and any changes.
Copyrighted materials, available under Fair Use and the TEACH Act for US-based educators, or other custom arrangements. Go to the resource provider to see their individual restrictions.