Oil spills have been a persistent problem since the start of the …
Oil spills have been a persistent problem since the start of the oil industry. Millions of wells and trillions of barrels of oil extracted have resulted in significant environmental impact. Accidents in the complex supply chain release toxic crude and refined oil, posing health risks and requiring costly cleanup. Safety measures have improved, but unreported spills remain a concern.
The efficiency of a thermal power plant is the ratio of the …
The efficiency of a thermal power plant is the ratio of the electricity output to the energy input, taking into account the heat losses. Over the years, the average efficiency of thermal power plants using fossil fuels in the United States has significantly increased, from 4% in 1900 to 43% in 2023. This improvement is attributed to reducing heat loss in the three main energy conversion processes: fuel combustion, steam generation, and electricity generation.
This simulation is showing the Race between a dropped ball and one …
This simulation is showing the Race between a dropped ball and one launched horizontally هذه المحاكاة توضح الفرق بالسرعه بين كرة سقطت من الأعلى الى الأسفل وبين كرة اطلقت من الأسفل الى الأعلى.
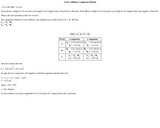
This simulation involves relative velocity in one dimension. It is an out-and-back …
This simulation involves relative velocity in one dimension. It is an out-and-back race between two women. Mia runs on the moving sidewalk, while Brandi runs on the non-moving floor. Under what conditions is the race a tie? Under what conditions does Mia win? Under what conditions does Brandi win?
Uranium is crucial for nuclear power generation, supplying 10% of global electricity. …
Uranium is crucial for nuclear power generation, supplying 10% of global electricity. The largest recoverable uranium resources are held by Australia, Kazakhstan, Canada, Russia, and Namibia. Major uranium consumers rely on imports due to limited domestic production, leading to significant international trade in uranium products.
In this simulation, you see, on the left, a picture of a …
In this simulation, you see, on the left, a picture of a box at rest on a table. You can apply a force to the box - note that you set the y-component and the x-component separately. On the right, you can see the full free-body diagram of the box. The free-body diagram shows the gravitational force exerted on the box by the Earth, the normal force exerted by the table, the force that you apply, and, if there is one, the static force of friction. Note that, on the free-body diagram, the force of gravity and the normal force have been shifted horizontally a little so they can be seen more easily. If there is a net force, that is also indicated.
Access to personal mobility has played a crucial role in people's life …
Access to personal mobility has played a crucial role in people's life satisfaction, with personal vehicles revolutionizing daily life since the early 1900s. The number of global car registrations has dramatically increased over the years, reaching 1.1 billion in 2019. The energy historian Roger Fouquet explored the impact of personal transportation services in the United Kingdom from the 14th to the 20th century, revealing the economic, social, and environmental changes brought about by the expansion of personal travel.
Electricity in the United States has seen remarkable growth, with a significant …
Electricity in the United States has seen remarkable growth, with a significant shift from coal to renewable energy sources. Government policies and technological advancements have played a crucial role in shaping the energy landscape. President Biden's goal of achieving 100% carbon-free electricity by 2035 highlights the need for continued progress in policy, technology, and public perception.
The United States has experienced a substantial increase in energy consumption over …
The United States has experienced a substantial increase in energy consumption over time, driven by factors like population growth and technological advancements. The transition from forests to coal, followed by oil and natural gas, has shaped the country's energy sources. However, fossil fuels still dominate energy use, highlighting the need for a rapid shift towards renewable and low-carbon alternatives.
This web page is an interactive physics problem on vector addition. The …
This web page is an interactive physics problem on vector addition. The page explains the concept of breaking a vector into components and adding them together, and works through an example problem. The attached Java applet visualizes the problem. This is part of a collection of similar simulation-based student activities.
More than 4000 hydroelectric dams have been built in the United States …
More than 4000 hydroelectric dams have been built in the United States since the late 19th century, representing six percent of all-time additions to electric generation capacity from all sources.
In 2022, the US had about 4,000 petroleum-burning generators, providing only 0.6% …
In 2022, the US had about 4,000 petroleum-burning generators, providing only 0.6% of the nation's electricity due to lower efficiency and higher costs than alternatives. These smaller generators are mainly used for peak power and emergency backup, with policies since 1978 discouraging their use to reduce oil dependence for national security.
In 2022, the United States saw a significant rise in solar power …
In 2022, the United States saw a significant rise in solar power generation, with 5730 utility-scale solar PV plants and 13 solar thermal plants producing 146 terawatt-hours (TWh) of electricity, equal to 3.4% of total utility-scale generation. This growth traces back to the 2000s, marked by falling solar system costs, enhanced efficiency, and government incentives like the American Recovery and Reinvestment Act of 2009.
Weatherization offers energy and non-energy benefits to households. It involves insulating homes, …
Weatherization offers energy and non-energy benefits to households. It involves insulating homes, installing energy-efficient systems, and reducing energy bills. Non-energy benefits include improved health outcomes, such as reduced thermal stress and asthma symptoms. However, challenges like deferred assistance, low coverage, and bias against renters limit the program's impact.
Of the millions of wells drilled, approximately 3.5 million are now abandoned, …
Of the millions of wells drilled, approximately 3.5 million are now abandoned, with some being properly plugged and others left unplugged. Unplugged wells can emit greenhouse gases, contaminate surrounding environments, and pose safety hazards. Orphaned wells, which lack a responsible operator, become the financial responsibility of the government and taxpayers.
Access to clean cooking fuels is crucial for gender equity and poverty …
Access to clean cooking fuels is crucial for gender equity and poverty alleviation. Currently, billions of people lack safe and affordable energy sources for cooking. Women and girls bear a disproportionate burden in collecting and processing polluting fuels, affecting their well-being and opportunities. Clean cooking energy reduces cooking time, allowing women to engage in other activities like childcare, work, and household chores.
No restrictions on your remixing, redistributing, or making derivative works. Give credit to the author, as required.
Your remixing, redistributing, or making derivatives works comes with some restrictions, including how it is shared.
Your redistributing comes with some restrictions. Do not remix or make derivative works.
Most restrictive license type. Prohibits most uses, sharing, and any changes.
Copyrighted materials, available under Fair Use and the TEACH Act for US-based educators, or other custom arrangements. Go to the resource provider to see their individual restrictions.