A full AP® Statistics curriculum that explores relevant data in social issues, …
A full AP® Statistics curriculum that explores relevant data in social issues, economics, medicine, sports, and more. The sequence works well in conjunction with the course CED and the most widely-used AP® Statistics textbooks.
This task examines, from a mathematical and statistical point of view, how …
This task examines, from a mathematical and statistical point of view, how scientists measure the age of organic materials by measuring the ratio of Carbon 14 to Carbon 12. The focus here is on the statistical nature of such dating. This task addresses a very important issue about precision in reporting and understanding statements in a realistic scientific context.
In this module, students reconnect with and deepen their understanding of statistics …
In this module, students reconnect with and deepen their understanding of statistics and probability concepts first introduced in Grades 6, 7, and 8. Students develop a set of tools for understanding and interpreting variability in data, and begin to make more informed decisions from data. They work with data distributions of various shapes, centers, and spreads. Students build on their experience with bivariate quantitative data from Grade 8. This module sets the stage for more extensive work with sampling and inference in later grades.
Find the rest of the EngageNY Mathematics resources at https://archive.org/details/engageny-mathematics.
This lesson unit is intended to help teachers assess how well students …
This lesson unit is intended to help teachers assess how well students understand the notion of correlation. In particular this unit aims to identify and help students who have difficulty in: understanding correlation as the degree of fit between two variables; making a mathematical model of a situation; testing and improving the model; communicating their reasoning clearly; and evaluating alternative models of the situation.
This task requires students to use the normal distribution as a model …
This task requires students to use the normal distribution as a model for a data distribution. Students must use given means and standard deviations to approximate population percentages. There are several ways (tables, graphing calculators, or statistical software) that students might calculate the required normal percentages. Depending on the method used, answers might vary somewhat from those shown in the solution.
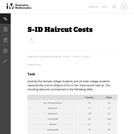
This problem could be used as an introductory lesson to introduce group …
This problem could be used as an introductory lesson to introduce group comparisons and to engage students in a question they may find amusing and interesting. More generally, the idea of the lesson could be used as a template for a project where students develop a questionnaire, sample students at their school and report on their findings.
This is a task from the Illustrative Mathematics website that is one …
This is a task from the Illustrative Mathematics website that is one part of a complete illustration of the standard to which it is aligned. Each task has at least one solution and some commentary that addresses important aspects of the task and its potential use.
This lesson unit is intended to help teachers assess how well students …
This lesson unit is intended to help teachers assess how well students are able to: interpret data and evaluate statistical summaries; and critique someone elseŐs interpretations of data and evaluations of statistical summaries. The lesson also introduces students to the dangers of misapplying simple statistics in real-world contexts, and illustrates some of the common abuses of statistics and charts found in the media.
The intent of clarifying statements is to provide additional guidance for educators …
The intent of clarifying statements is to provide additional guidance for educators to communicate the intent of the standard to support the future development of curricular resources and assessments aligned to the 2021 math standards. Clarifying statements can be in the form of succinct sentences or paragraphs that attend to one of four types of clarifications: (1) Student Experiences; (2) Examples; (3) Boundaries; and (4) Connection to Math Practices.
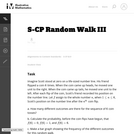
This task provides a context to calculate discrete probabilities and represent them …
This task provides a context to calculate discrete probabilities and represent them on a bar graph. It could also be used to create a class activity where students gather, represent, and analyze data, running simulations of the random walk and recording and then displaying their results.
This is a task from the Illustrative Mathematics website that is one …
This is a task from the Illustrative Mathematics website that is one part of a complete illustration of the standard to which it is aligned. Each task has at least one solution and some commentary that addresses important aspects of the task and its potential use.
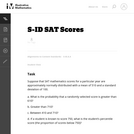
The purpose of this task is to have students complete normal distribution …
The purpose of this task is to have students complete normal distribution calculations and to use properties of normal distributions to draw conclusions. The task is designed to encourage students to communicate their findings in a narrative/report form in context Đ not just simply as a computed number.
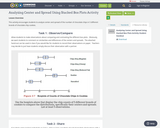
The purpose of this task is to allow students to demonstrate an …
The purpose of this task is to allow students to demonstrate an ability to construct boxplots and to use boxplots as the basis for comparing distributions. The solution should directly compare the center, spread, and shape of the two distributions and comment on the high outlier in the northbound data set.
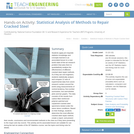
Students apply pre-requisite statistics knowledge and concepts learned in an associated lesson …
Students apply pre-requisite statistics knowledge and concepts learned in an associated lesson to a real-world state-of-the-art research problem that asks them to quantitatively analyze the effectiveness of different cracked steel repair methods. As if they are civil engineers, students statistically analyze and compare 12 sets of experimental data from seven research centers around the world using measurements of central tendency, five-number summaries, box-and-whisker plots and bar graphs. The data consists of the results from carbon-fiber-reinforced polymer patched and unpatched cracked steel specimens tested under the same stress conditions. Based on their findings, students determine the most effective cracked steel repair method, create a report, and present their results, conclusions and recommended methods to the class as if they were presenting to the mayor and city council. This activity and its associated lesson are suitable for use during the last six weeks of the AP Statistics course; see the topics and timing note for details.
(Nota: Esta es una traducción de un recurso educativo abierto creado por …
(Nota: Esta es una traducción de un recurso educativo abierto creado por el Departamento de Educación del Estado de Nueva York (NYSED) como parte del proyecto "EngageNY" en 2013. Aunque el recurso real fue traducido por personas, la siguiente descripción se tradujo del inglés original usando Google Translate para ayudar a los usuarios potenciales a decidir si se adapta a sus necesidades y puede contener errores gramaticales o lingüísticos. La descripción original en inglés también se proporciona a continuación.)
En este módulo, los estudiantes reconectan y profundizan su comprensión de las estadísticas y los conceptos de probabilidad introducidos por primera vez en los grados 6, 7 y 8. Los estudiantes desarrollan un conjunto de herramientas para comprender e interpretar la variabilidad en los datos, y comienzan a tomar decisiones más informadas de los datos . Trabajan con distribuciones de datos de varias formas, centros y diferenciales. Los estudiantes se basan en su experiencia con datos cuantitativos bivariados del grado 8. Este módulo prepara el escenario para un trabajo más extenso con muestreo e inferencia en calificaciones posteriores.
Encuentre el resto de los recursos matemáticos de Engageny en https://archive.org/details/engageny-mathematics.
English Description: In this module, students reconnect with and deepen their understanding of statistics and probability concepts first introduced in Grades 6, 7, and 8. Students develop a set of tools for understanding and interpreting variability in data, and begin to make more informed decisions from data. They work with data distributions of various shapes, centers, and spreads. Students build on their experience with bivariate quantitative data from Grade 8. This module sets the stage for more extensive work with sampling and inference in later grades.
Find the rest of the EngageNY Mathematics resources at https://archive.org/details/engageny-mathematics.
No restrictions on your remixing, redistributing, or making derivative works. Give credit to the author, as required.
Your remixing, redistributing, or making derivatives works comes with some restrictions, including how it is shared.
Your redistributing comes with some restrictions. Do not remix or make derivative works.
Most restrictive license type. Prohibits most uses, sharing, and any changes.
Copyrighted materials, available under Fair Use and the TEACH Act for US-based educators, or other custom arrangements. Go to the resource provider to see their individual restrictions.