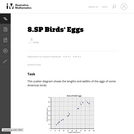
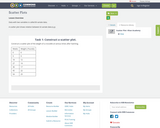
This task asks students to glean contextual information about bird eggs from …
This task asks students to glean contextual information about bird eggs from a collection of measurements of said eggs organized in a scatter plot. In particular, students are asked to identify a correlation and use it to make interpolative predictions, and reason about the properties of specific eggs via the graphical presentation of the data.
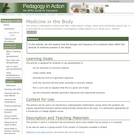
You are probably asking yourself the question, "When and where will I …
You are probably asking yourself the question, "When and where will I use statistics?". If you read any newspaper or watch television, or use the Internet, you will see statistical information. There are statistics about crime, sports, education, politics, and real estate. Typically, when you read a newspaper article or watch a news program on television, you are given sample information. With this information, you may make a decision about the correctness of a statement, claim, or "fact." Statistical methods can help you make the "best educated guess."
Geospatial data analysis is a growing field in science with practical applications …
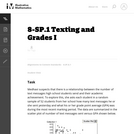
Geospatial data analysis is a growing field in science with practical applications in government and industry. This problem-based learning module guides learners through exploring the relationship between the amount of trash found relative to the location of waste receptacles in their community. Recording the location of identified items of trash/recyclables and placing them on a map allows students to identify if there is a correlation between the amount of trash and the distance away from waste receptacles. While this module uses trash, almost any item can be tracked and plotted for analysis. Some other ideas were: locations of Pokemon in Pokemon Go, animal migration, safety devices, various plant species, texting and driving are just a few examples.
No restrictions on your remixing, redistributing, or making derivative works. Give credit to the author, as required.
Your remixing, redistributing, or making derivatives works comes with some restrictions, including how it is shared.
Your redistributing comes with some restrictions. Do not remix or make derivative works.
Most restrictive license type. Prohibits most uses, sharing, and any changes.
Copyrighted materials, available under Fair Use and the TEACH Act for US-based educators, or other custom arrangements. Go to the resource provider to see their individual restrictions.