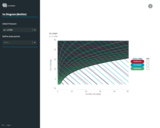
Interactive hx diagram (Mollier) for displaying the changes in state of humid air at sensible temperature change, wet cooling, mixture air, humidification and custom state points.
Automatic calculation of the required heat flow for cooling and heating. Free online tool, no registration required.
More detailed information:
To analyze changes of state of moist air normally a diagram with the specific enthalpy as the ordinate and the humidity ration as the abscissa is used. This specific type of diagram was proposed in 1923 by the German professor of applied physics and mechanics, Richard Mollier.
The Mollier diagram is respectively created for a certain constant pressure, usually the atmospheric pressure (p≈1bar).
The thermodynamic properties of moist air are represented in the state diagram as lines of constant state variables - so-called isolines.
- Subject:
- Applied Science
- Engineering
- Mathematics
- Measurement and Data
- Physical Science
- Physics
- Material Type:
- Diagram/Illustration
- Interactive
- Date Added:
- 03/10/2021