Students will examine and interact with two economic data websites—FRED®, of the …
Students will examine and interact with two economic data websites—FRED®, of the Federal Reserve Bank of St. Louis, and the Bureau of Economic Analysis (BEA)—to develop their understanding of the information creation process. They will learn about differences between data aggregators and data sources and the capabilities and constraints of each in presenting economic data. Students will examine in detail gross domestic product (GDP) data.
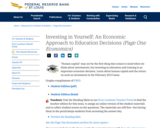
"Human capital" may not be the first thing that comes to mind …
"Human capital" may not be the first thing that comes to mind when we think about investments, but investing in education and training is an important economic decision. Learn about human capital and the return on such an investment in the February 2013 issue.
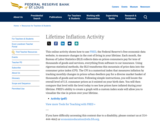
This online activity shows how to use FRED, the Federal Reserve's free …
This online activity shows how to use FRED, the Federal Reserve's free economic data website, to measure changes in the cost of living in your lifetime. Each month, the Bureau of Labor Statistics (BLS) collects data on prices consumers pay for tens of thousands of goods and services, everything from software to car insurance. Using rigorous statistical methods, the BLS transforms this mountain of price data into the consumer price index (CPI). The CPI is a numerical index that measures inflation by tracking monthly changes in prices urban dwellers pay for a diverse market basket of thousands of goods and services. Following simple instructions, you will locate the overall level of U.S. consumer prices as it existed on your birth date. You will then compare that level with the level today to see how prices have inflated during your lifetime. FRED's ability to create a graph with a custom index scale will allow you to visualize the rise in prices over your lifetime.
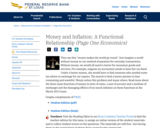
They say that "money makes the world go round." Just imagine a …
They say that "money makes the world go round." Just imagine a world without money as our method of payment for everyday transactions. Without money, we would all need to barter for necessary goods and services. For example, suppose an accountant needs to have her car fixed. Under a barter system, she would have to find someone who needed some tax advice in exchange for car repairs. The search to find a barter partner is time consuming and wasteful. Money solves this problem and many others. Read more about the three main functions of money and the damaging effects of too much inflation on these functions in the March 2013 issue.
Nebraska standards that detail the essential knowledge and skills necessary for educators …
Nebraska standards that detail the essential knowledge and skills necessary for educators to effectively use data to inform instructional and programmatic decisions.
The output gap is one (of many) economic indicators used by economists …
The output gap is one (of many) economic indicators used by economists to measure the strength of the economy. What exactly is the output gap, and how accurately does it predict the state of the economy? Read the November 2012 issue for an explanation of the output gap and answers to these questions.
Remember when airlines started charging for checked bags? What happened to the …
Remember when airlines started charging for checked bags? What happened to the number of checked bags after this added charge? And what happened to the availability of in-cabin storage space on planes? The April 2013 issue answers these questions and discusses the pivotal role price plays in a market economy.
Students learn to identify and evaluate the authority of data and the …
Students learn to identify and evaluate the authority of data and the authors who publish interpretations of data. They review a dataset from FRED® and determine the authority of the dataset based on shared criteria. They also review that same dataset in several interpretations published in blogs and articles, applying the criteria to analyze the authority. Students discuss how they determined authority in pairs and share back their thoughts to the class.
From "The Spectrum of Apple Flavors" to "We are all Zebras: How Rare …
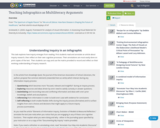
From "The Spectrum of Apple Flavors" to "We are all Zebras: How Rare Disease is Shaping the Future of Healthcare," we find colorful visual displays of information and data used to persuade, inform and delight their audience-readers. Most infographic assignments result in loose collections of related facts and numbers, essentially a collage or poster. Student create displays of unrelated factoids and spurious data correlations and they "ooh" and "ahhh" at beautiful nothings. However, the visual and textual elements of an infographic can culminate in a coherent multimodal argument which prompts inquiry in the creator and the audience. In order to teach infographics as a claim expressed through visual metaphor, supported by reasoning with evidence in multiple modes, instructors employ a sequence of interventions to invoke the relevant skills and strategies at appropriate moments. Composing and critiquing infographics can enhance understanding of both the content and rhetoric, since people analyze, elaborate and critique information more deeply when visual and textal modes are combined (Lazard and Atkinson 2014).This pedagogy of reading and writing multiple literacies can be adapted to other multimodal products. For an overview, refer to "Recipe for an Infographic" (Abilock and Williams 2014) which is also listed in the references for this module. We recommend that you experience this process yourself as you teach it to students.
From "The Spectrum of Apple Flavors" to "We are all Zebras: How Rare …
From "The Spectrum of Apple Flavors" to "We are all Zebras: How Rare Disease is Shaping the Future of Healthcare," we find colorful visual displays of infGrotewold, K. (2020, August). Framework for analysis of visual information. In Assessing Visual Materials for Diversity & Inclusivity. https://www.oercommons.org/courseware/lesson/69336/. Licensed as CC BY-NC-SA
Modern economies rely heavily on financial intermediaries to channel funds between borrowers …
Modern economies rely heavily on financial intermediaries to channel funds between borrowers and lenders. In this issue, the role of traditional banking is outlined and a parallel system—shadow banking—is explored.
The average saving rate for the typical American household before the recession …
The average saving rate for the typical American household before the recession started in 2007 was 2.9 percent; since then it has risen to 5 percent. Uncertainty about the future was the primary driver for the increase. More saving is a good thing, right? Well, some economists argue it might be detrimental to the overall economy. Given the benefits to individuals, how could this be? The May 2012 issue explores this "paradox of thrift."
No restrictions on your remixing, redistributing, or making derivative works. Give credit to the author, as required.
Your remixing, redistributing, or making derivatives works comes with some restrictions, including how it is shared.
Your redistributing comes with some restrictions. Do not remix or make derivative works.
Most restrictive license type. Prohibits most uses, sharing, and any changes.
Copyrighted materials, available under Fair Use and the TEACH Act for US-based educators, or other custom arrangements. Go to the resource provider to see their individual restrictions.