In this lesson, students explore rate in the context of grocery shopping. …
In this lesson, students explore rate in the context of grocery shopping. Students use the unit price, or price per egg, to find the price of any number of eggs.Key ConceptsA unit price is a rate. The unit price tells the price of one unit of something (for example, one pound of cheese, one quart of milk, one box of paper clips, one package of cereal, and so on).The unit price can be found by dividing the price in dollars by the number of units.The unit price can be used to find the price of any quantity of something by multiplying the unit price by the quantity.Goals and Learning ObjectivesInvestigate rate as a unit price.Find a unit price by dividing the price in dollars by the number of units.Find the price of any quantity of something by multiplying that quantity by the unit price.
In this lesson, students use an interactive map to compare the crowdedness …
In this lesson, students use an interactive map to compare the crowdedness of three countries of their choice. They learn that to compare countries with different areas and populations, they need to calculate population density—a rate that compares the population of a region to its area.Key ConceptsA ratio is a comparison of two quantities by division. It can be expressed in the forms a to b, a:b, or ab, where b ≠ 0. The value of a ratio is found by dividing the two quantities. A ratio provides a relative comparison of two quantities. A rate is a ratio that compares two quantities measured in different units. Population density is a rate that compares the population of a region to its area. The value is given in number of people per unit of area.ELL: Identifying key words are crucial for students. Spend some time discussing the key vocabulary in this unit.Goals and Learning ObjectivesExplore rate in the context of population density.Compare three countries to see which is most crowded—that is, which has the greatest population density.
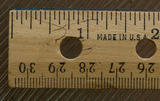
In this lesson, students use a ruler that measures both inches and …
In this lesson, students use a ruler that measures both inches and centimeters to find conversion factors for converting inches to centimeters and centimeters to inches.Key ConceptsRates can be used to convert a measurement in one unit to a corresponding measurement in another unit. We call rates that are used for such purposes conversion factors.The conversion factor 2.54 centimeters per inch is used to convert a measurement in inches to a measurement in centimeters (or, from the English system to the metric system).The conversion factor 0.3937 inches per centimeter is used to convert a measurement in centimeters to a measurement in inches (or, from the metric system to the English system).In the calculation, the inch units cancel out and the remaining centimeter units are the units of the answer, or vice versa.Goals and Learning ObjectivesExplore rate in the context of finding and using conversion factors.Understand that there are two conversion factors that translate a measurement in one unit to a corresponding measurement in another unit, and that these two conversion factors are inverses of one another.
In this lesson, students write formulas to represent different rate relationships.Key ConceptsA …
In this lesson, students write formulas to represent different rate relationships.Key ConceptsA formula is a mathematical way of writing a rule for computing a value.Formulas, like c = 2.50w or d = 20g, describe the relationship between quantities.The formula c = 2.50w describes the relationship between a cost and a quantity that costs $2.50 per unit of weight. Here, w stands for any weight, and c stands for the cost of w pounds at $2.50 per pound.The formula d = 20g describes the relationship between the distance, d, and the number of gallons of gas, g, for a car that gets 20 miles per gallon.Goals and Learning ObjectivesUse equations with two variables to express relationships between quantities that vary together.
In this lesson, students first watch three racers racing against each other. …
In this lesson, students first watch three racers racing against each other. The race is shown on a track and represented on a graph. Students then change the speed, distance, and time to create a race with different results. They graph the new race and compare their graph to the original race graph.Key ConceptsA rate situation can be represented by a graph. Each point on a graph represents a pair of values. In today's situation, each point represents an amount of time and the distance a racer traveled in that amount of time. Time is usually plotted on the horizontal axis. The farther right a point is from the origin, the more time has passed from the start. Distance is usually plotted on the vertical axis. The higher up a point is from the origin, the farther the snail has traveled from the start. A graph of a constant speed is a straight line. Steeper lines show faster speeds.Goals and Learning ObjectivesUnderstand that a graph can be a visual representation of an actual rate situation.Plot pairs of related values on a graph.Use graphs to develop an understanding of rates.
In this lesson, students watch a video of a runner and express …
In this lesson, students watch a video of a runner and express his speed as a rate in meters per second. Students then use the rate to determine how long it takes the runner to go any distance.Key ConceptsSpeed is a rate that is expressed as distance traveled per unit of time. Miles per hour, laps per minute, and meters per second are all examples of units for speed. The measures of speed, distance, and time are all related. The relationship can be expressed in three ways: d = rt, r = dt, t = dr.Goals and Learning ObjectivesExplore speed as a rate that measures the relationship between two aspects of a situation: distance and time.In comparing distance, speed, and time, understand how to use any two of these measures to find the third measure.
Students use their knowledge of rates to solve problems.Key ConceptsGiven any two …
Students use their knowledge of rates to solve problems.Key ConceptsGiven any two values in a rate situation, you can find the third value.These three equations are equivalent, and they all describe rate relationships:y = rx, r = yx, x = yrAt the beginning of this lesson (or for homework), students will revise their work on the pre-assessment Self Check. Their revised work will provide data that you and your students can use to reassess students' understanding of rate. You can use this information to clear up any remaining misconceptions and to help students integrate their learning from the past several days into a deeper and more coherent whole.The work students do in this lesson and in revising their pre-assessments will help you and your students decide how to help them during the Gallery. In this lesson, students will reveal the depth and clarity of their understanding of rate.Students whose understanding of rate is still delicate should get extra help during the Gallery.Students who feel that they have a robust understanding of rate may choose from any of the problem-solving or deeper mathematics problems in the Gallery.Goals and Learning ObjectivesUncover any partial understandings and misconceptions about rate.Develop a more robust understanding of rate.Identify which Gallery problems to work on.
Students watch a video in which two students discuss the problem of …
Students watch a video in which two students discuss the problem of how to compare fuel efficiency. Students then analyze the work of the two students as they use rates to determine fuel efficiency in two different ways.Key ConceptsFuel efficiency is a rate. Fuel efficiency can be expressed in miles per gallon (mpg). This rate is useful for determining how far a vehicle can travel using any number of gallons of gas. Fuel efficiency can also be expressed in gallons per mile (gpm). This rate is useful for determining how many gallons of gas a vehicle uses to travel any number of miles.The rates miles per gallon and gallons per mile are inverse rates—they both describe the same relationship. For example, the rates 20 miles per gallon and 0.05 gallon per mile both describe the relationship between 300 miles and 15 gallons. The greater the rate in miles per gallon, the better the fuel efficiency. The smaller the rate in gallons per mile, the better the fuel efficiency.SWD: Some students with disabilities will benefit from a preview of the goals in each lesson. This will help to highlight for students the critical features and/or concepts and will help them to pay close attention to salient information.Goals and Learning ObjectivesExplore rate in the context of fuel efficiency.Express fuel efficiency as the rate miles per gallon (mpg) and as its inverse, gallons per mile (gpm).Use the rate miles per gallon to find the number of miles a car can travel on a number of gallons of gas.Use the rate gallons per mile to find the number of gallons of gas used for a number of miles driven.
Ratios Type of Unit: Concept Prior Knowledge Students should be able to: …
Ratios
Type of Unit: Concept
Prior Knowledge
Students should be able to:
Calculate with whole numbers up to 100 using all four operations. Understand fraction notation and percents and translate among fractions, decimal numbers, and percents. Interpret and use a number line. Use tables to solve problems. Use tape diagrams to solve problems. Sketch and interpret graphs. Write and interpret equations.
Lesson Flow
The first part of the unit begins with an exploration activity that focuses on a ratio as a way to compare the amount of egg and the amount of flour in a mixture. The context motivates a specific understanding of the use of, and need for, ratios as a way of making comparisons between quantities. Following this lesson, the usefulness of ratios in comparing quantities is developed in more detail, including a contrast to using subtraction to find differences. Students learn to interpret and express ratios as fractions, as decimal numbers, in a:b form, in words, and as data; they also learn to identify equivalent ratios.
The focus of the middle part of the unit is on the tools used to represent ratio relationships and on simplifying and comparing ratios. Students learn to use tape diagrams first, then double number lines, and finally ratio tables and graphs. As these tools are introduced, students use them in problem-solving contexts to solve ratio problems, including an investigation of glide ratios. Students are asked to make connections and distinctions among these forms of representation throughout these lessons. Students also choose a ratio project in this part of the unit (Lesson 8).
The third and last part of the unit covers understanding percents, including those greater than 100%.
Students have ample opportunities to check, deepen, and apply their understanding of ratios, including percents, with the selection of problems in the Gallery.
Students watch a video in which a double number line is used …
Students watch a video in which a double number line is used to solve a problem about getting the right amount of protein mix. Using the double number line is an example of modeling with mathematics, which is Mathematical Practice 4.Key ConceptsA double number line shows corresponding values for two variable quantities with a constant ratio between them. Each pair of tick marks that go together shows a ratio equivalent to all of the other ratios between corresponding tick marks.Goals and Learning ObjectivesWatch an example of students using mathematics to model a relationship between quantities (MP4).Use a double number line to solve a problem.Use a double number line to deepen understanding of equivalence in the context of a relationship between quantities with a constant ratio.SWD: Some students with disabilities will benefit from a preview of the goals in each lesson. Students can highlight the critical features and/or concepts and will help them to pay close attention to salient information.
Students use double number lines to model relationships and to solve ratio …
Students use double number lines to model relationships and to solve ratio problems.Key ConceptsDouble number line diagrams are useful for visualizing ratio relationships between two quantities. They are best used when the quantities have different units. (The unit rate appears paired with 1.) Double number line diagrams help students more easily “see” that there are many equivalent forms of the same ratio.Goals and Learning ObjectivesUnderstand double number line diagrams as a way to visually compare two quantities.Use double number line diagrams to solve ratio problems.
Students work with a set of cards showing different ways of expressing …
Students work with a set of cards showing different ways of expressing ratios numerically. They group the cards showing equivalent ratios and then order the groups from least to greatest value.Key ConceptsIt can be hard to compare the values of ratios represented in different forms (e.g., a:b, decimal, fraction, a to b). Simplifying ratios makes it easier to compare and order their values.Goals and Learning ObjectivesIdentify ratios that are equivalent but expressed differently.Simplify ratios in order to group and order cards efficiently and successfully.
Students use informal methods of their own choosing to find percents of …
Students use informal methods of their own choosing to find percents of randomly generated monetary values.Key ConceptsMany approaches work for solving percent problems. This lesson focuses on experimenting with a range of approaches and understanding why and how multiple approaches yield correct results.Goals and Learning ObjectivesFind a percent of a given quantity.Find a quantity given a part and the percent that part is of the whole.Use percents in money calculations.
This lesson introduces the concept of a glide ratio and encourages students …
This lesson introduces the concept of a glide ratio and encourages students to use appropriate tools strategically (Mathematical Practice 5). Students use tape diagrams, double number lines, ratio tables, graphs, and equations to represent glide ratios.Key ConceptsA glide ratio for an object or an organism in flight is the ratio of forward distance to vertical distance (in the absence of power and wind). For a given object or organism that glides, this ratio has a constant value and is treated as a feature of the object or organism.Goals and Learning ObjectivesUnderstand the concept of a glide ratio.Make connections within and between different ways of representing ratios.
Students interpret multiple categories of data about a hypothetical village population that …
Students interpret multiple categories of data about a hypothetical village population that represents the global population. They determine whether percent statements about the data are true or false.Key ConceptsData presented in multiple formats can be investigated using percent statements that facilitate comparisons between different parts of a whole. In using percents to interpret data, it is essential to be clear about what the part is and what the whole is. The whole in this lesson is a representative sample of the global population, which is used as a model for investigating variation across the population.Goals and Learning ObjectivesInterpret data presented in different formats in terms of percents.Identify percent statements as true or false, if possible, and explain the decision.Modify false percents statements to make them true.
Students use percents greater than 100% to solve problems about rainfall, revenue, …
Students use percents greater than 100% to solve problems about rainfall, revenue, snowfall, and school attendance.Key ConceptsPercents greater than 100% are useful in making comparisons between the values of a single quantity at two points in time. When a later value is more than 100% of an earlier value, it means the quantity has increased over time. This percent comparison can be used to find unknown values, whether the earlier or later value is unknown.Goals and Learning ObjectivesUnderstand the meaning of a percent greater than 100% in real-world situations.Use percents greater than 100% to interpret situations and solve problems.
Students focus on interpreting, creating, and using ratio tables to solve problems. …
Students focus on interpreting, creating, and using ratio tables to solve problems. They also relate ratio tables to graphs as two ways of representing a relationship between quantities.Key ConceptsRatio tables and graphs are two ways of representing relationships between variable quantities. The values shown in a ratio table give possible pairs of values for the quantities represented and define ordered pairs of coordinates of points on the graph representing the relationship. The additive and multiplicative structure of each representation can be connected, as shown: Goals and Learning ObjectivesComplete ratio tables.Use ratio tables to compare ratios and solve problems.Plot values from a ratio table on a graph.Understand the connection between the structure of ratio tables and graphs.
Students begin the lesson with a critique of their own work on …
Students begin the lesson with a critique of their own work on the Self Check using questions and comments from you to reflect on their work. They then critique three examples of student work on the task, each with its own tools for modeling the given relationship between quantities. Finally, they apply what they learned to a closely related problem.Key ConceptsStudents reflect on their work and connect different ways of representing ratio relationships: tape diagrams, double number lines, and ratio tables.Goals and Learning ObjectivesUse teacher comments to refine solution strategies for ratio problems.Deepen understanding of ratio relationships.Synthesize and connect strategies for representing and investigating ratio relationships.Critique given student models created to solve ratio problems.Apply deepened understanding of ratio relationships to a new ratio problem.
Students use tape diagrams to model relationships and solve problems about types …
Students use tape diagrams to model relationships and solve problems about types of DVDs.Key ConceptsTape diagrams are useful for visualizing ratio relationships between two (or more) quantities that have the same units. They can be used to highlight the multiplicative relationship between the quantities.Goals and Learning ObjectivesUnderstand tape diagrams as a way to visually compare two or more quantities.Use tape diagrams to solve ratio problems.
Students focus on interpreting, creating, and using ratio tables to solve problems.Key …
Students focus on interpreting, creating, and using ratio tables to solve problems.Key ConceptsA ratio table shows pairs of corresponding values, with an equivalent ratio between each pair. Ratio tables have both an additive and a multiplicative structure:Goals and Learning ObjectivesComplete ratio tables.Use ratio tables to solve problems.
No restrictions on your remixing, redistributing, or making derivative works. Give credit to the author, as required.
Your remixing, redistributing, or making derivatives works comes with some restrictions, including how it is shared.
Your redistributing comes with some restrictions. Do not remix or make derivative works.
Most restrictive license type. Prohibits most uses, sharing, and any changes.
Copyrighted materials, available under Fair Use and the TEACH Act for US-based educators, or other custom arrangements. Go to the resource provider to see their individual restrictions.