Life expectancy data for nearly all countries, most for every year from …
Life expectancy data for nearly all countries, most for every year from 2005 and 2008. Life expectancy in many countries varies widely from the world average of 69 years which is increasing.
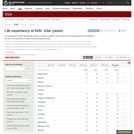
The MPC is one of the world's leading developers of demographic data …
The MPC is one of the world's leading developers of demographic data resources. We provide population data to thousands of researchers, policymakers, teachers, and students. All MPC data are available free over the internet.
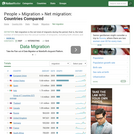
Map showing America broken down by various measures of standard of living, …
Map showing America broken down by various measures of standard of living, environmental impact, demographics and crime. Focuses on applying the Human Development Index -- the major measure of international development -- to inequalities within in the United States.
List of countries with their annual methane emissions. The data are from …
List of countries with their annual methane emissions. The data are from 2005. The data are given in total annual emissions, thus must be compared with economic activity, geographic and most importantly, population data to be relevant.
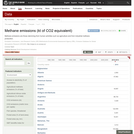
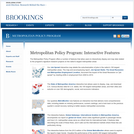
The Metropolitan Policy Program offers a number of features that allow users …
The Metropolitan Policy Program offers a number of features that allow users to interactively display and map data related to the program's signature research projects on the nation's largest metropolitan areas
Under five mortality data for nearly all countries in the world from …
Under five mortality data for nearly all countries in the world from 2005-2008. A broader measure of child health than infant mortality, this is the probability of dying before ones fifth birthday given the current rates. Rates in countries vary widely from the world average of 67-per-1000 which is decreasing.
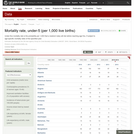
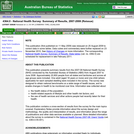
The survey was designed to obtain national benchmarks on a wide range …
The survey was designed to obtain national benchmarks on a wide range of health issues, and to enable changes in health to be monitored over time. Information was collected about: the health status of the population; health-related aspects of lifestyle and other health risk factors; and the use of health services and other actions people had recently taken for their health."
Bar chart of countries ranked by their net migration flow as of …
Bar chart of countries ranked by their net migration flow as of 2005. While the highest net in-flow is generally into large rich countries (USA, Spain, Germany etc.) Afghanistan had the second highest net inflow thanks to returning refugees.
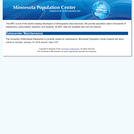
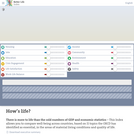
Interactive resource codes either "OECD large regions" usually the primary subnational administrative …
Interactive resource codes either "OECD large regions" usually the primary subnational administrative unit of an OECD country -- (eg. states) or "OECD small regions" usually the secondary subnmational administrative unit -- (eg. counties) by demographic, economic and educational statistics. Regions are compared on a color coded map (for any single variable), scatter plot (for any two variables, table lens or data grid (for a large number of variables. Allows transnational comparisons across all rich countries, but also allows the specificity of focusing on subnational -- and sometimes very small -- geographic units.
The goal of this module is to explore basic differences in partisanship …
The goal of this module is to explore basic differences in partisanship by demographic characteristics, including age, race, income, and gender. Crosstabulation and graphs will be used.
Map shows census divisions (a variably sized region ranging from 1100 and …
Map shows census divisions (a variably sized region ranging from 1100 and 2.5 million people) color coded by the percentage of people living in the area that lived in a different province or territory five years ago. CDs in sparsely populated regions are excluded. The map suggests that there is a great deal of migration into Alberta -- likely to work in the oil industry.
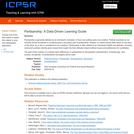
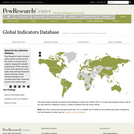
The Pew Research Center's Global Attitudes Project Global Indicators Database allows users …
The Pew Research Center's Global Attitudes Project Global Indicators Database allows users to select and display various indicators on a map by country.
The Pew Research Center for the People & the Press Poll Database …
The Pew Research Center for the People & the Press Poll Database includes survey questions from all national People & the Press polls. To search for a question, enter any keyword or combination of words and/or select a topic area of interest.
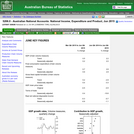
The population projections presented in this publication cover the period 30 June …
The population projections presented in this publication cover the period 30 June 2008 to 2101 for Australia and 30 June 2008 to 2056 for the states, territories, and capital cities/balances of state.
This issue contains estimates of the resident population of Australian states and …
This issue contains estimates of the resident population of Australian states and territories as at 30 June of each reference year. Estimates up to 2006 are final, based on the results of the 2006 Census of Population and Housing. Estimates for June 2007 have been revised and estimates from June 2008 onwards are preliminary.
No restrictions on your remixing, redistributing, or making derivative works. Give credit to the author, as required.
Your remixing, redistributing, or making derivatives works comes with some restrictions, including how it is shared.
Your redistributing comes with some restrictions. Do not remix or make derivative works.
Most restrictive license type. Prohibits most uses, sharing, and any changes.
Copyrighted materials, available under Fair Use and the TEACH Act for US-based educators, or other custom arrangements. Go to the resource provider to see their individual restrictions.