This task asks students to glean contextual information about bird eggs from …
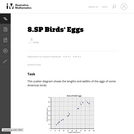
This task asks students to glean contextual information about bird eggs from a collection of measurements of said eggs organized in a scatter plot. In particular, students are asked to identify a correlation and use it to make interpolative predictions, and reason about the properties of specific eggs via the graphical presentation of the data.
Statistics is the study of variability. Students who understand statistics need to …
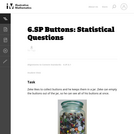
Statistics is the study of variability. Students who understand statistics need to be able to identify and pose questions that can be answered by data that vary. The purpose of this task is to provide questions related to a particular context (a jar of buttons) so that students can identify which are statistical questions. The task also provides students with an opportunity to write a statistical question that pertains to the context.
n this task, students are able to conjecture about the differences in …
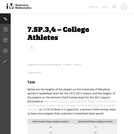
n this task, students are able to conjecture about the differences in the two groups from a strictly visual perspective and then support their comparisons with appropriate measures of center and variability. This will reinforce that much can be gleaned simply from visual comparison of appropraite graphs, particularly those of similar scale. Students are also encouraged to consider how certain measurements and observation values from one group compare in the context of the other group.
This task introduces the fundamental statistical ideas of using data summaries (statistics) …
This task introduces the fundamental statistical ideas of using data summaries (statistics) from random samples to draw inferences (reasoned conclusions) about population characteristics (parameters). In the task built around an election poll scenario, the population is the entire seventh grade class, the unknown characteristic (parameter) of interest is the proportion of the class members voting for a specific candidate, and the sample summary (statistic) is the observed proportion of voters favoring the candidate in a random sample of class members.
n addition to providing a task that relates to other disciplines (history, …
n addition to providing a task that relates to other disciplines (history, civics, current events, etc.), this task is intended to demonstrate that a graph can summarize a distribution as well as provide useful information about specific observations.
The task is designed to show that random samples produce distributions of …
The task is designed to show that random samples produce distributions of sample means that center at the population mean, and that the variation in the sample means will decrease noticeably as the sample size increases. Random sampling (like mixing names in a hat and drawing out a sample) is not a new idea to most students, although the terminology is likely to be new.
This task uses student generated data to assess standard 7.SP.7. This task …
This task uses student generated data to assess standard 7.SP.7. This task could also be extended to address Standard 7.SP.1 by adding a small or whole class discussion of whether the class could be considered as a representative sample of all students at your school.
In this group task students collect data and analyze from the class …
In this group task students collect data and analyze from the class to answer the question "is there an association between whether a student plays a sport and whether he or she plays a musical instrument? "
In this task, students are able to conjecture about the differences and …
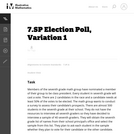
In this task, students are able to conjecture about the differences and similarities in the two groups from a strictly visual perspective and then support their comparisons with appropriate measures of center and variability. This will reinforce that much can be gleaned simply from visual comparison of appropriate graphs, particularly those of similar scale.
his task is intended as a classroom activity. Student pool the results …
his task is intended as a classroom activity. Student pool the results of many repetitions of the random phenomenon (rolling dice) and compare their results to the theoretical expectation they develop by considering all possible outcomes of rolling two dice. This gives them a concrete example of what we mean by long term relative frequency.
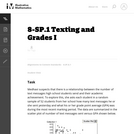
For this task, Minitab software was used to generate 100 random samples …
For this task, Minitab software was used to generate 100 random samples of size 16 from a population where the probability of obtaining a success in one draw is 33.6% (Bernoulli). Given that multiple samples of the same size have been generated, students should note that there can be quite a bit of variability among the estimates from random samples and that on average, the center of the distribution of such estimates is at the actual population value and most of the estimates themselves tend to cluster around the actual population value.
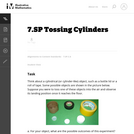
As the standards in statistics and probability unfold, students will not yet …
As the standards in statistics and probability unfold, students will not yet know the rules of probability for compound events. Thus, simulation is used to find an approximate answer to these questions. In fact, part b would be a challenge to students who do know the rules of probability, further illustrating the power of simulation to provide relatively easy approximate answers to wide-ranging problems.
No restrictions on your remixing, redistributing, or making derivative works. Give credit to the author, as required.
Your remixing, redistributing, or making derivatives works comes with some restrictions, including how it is shared.
Your redistributing comes with some restrictions. Do not remix or make derivative works.
Most restrictive license type. Prohibits most uses, sharing, and any changes.
Copyrighted materials, available under Fair Use and the TEACH Act for US-based educators, or other custom arrangements. Go to the resource provider to see their individual restrictions.