In this lesson, students will take temperature readings in the outdoor classroom, …
In this lesson, students will take temperature readings in the outdoor classroom, compare them to data from a graph, and discuss the numerical differences between the readings and the data.
In this lesson, students will take temperature readings in the outdoor classroom, …
In this lesson, students will take temperature readings in the outdoor classroom, compare them to data from a graph, and discuss the numerical differences between the readings and the data.
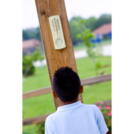
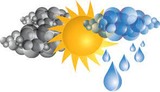
Students study photos and look for clues regarding weather conditions and seasonal …
Students study photos and look for clues regarding weather conditions and seasonal variations. Students make and record weather measurements in their outdoor space, including temperature, precipitation, wind speed and direction, humidity (optional) and cloudiness over time. As a culminating activity, students study local climate patterns to determine the best time to plant fruits and vegetables in their outdoor space and create analogies to describe the difference between weather and climate.
No restrictions on your remixing, redistributing, or making derivative works. Give credit to the author, as required.
Your remixing, redistributing, or making derivatives works comes with some restrictions, including how it is shared.
Your redistributing comes with some restrictions. Do not remix or make derivative works.
Most restrictive license type. Prohibits most uses, sharing, and any changes.
Copyrighted materials, available under Fair Use and the TEACH Act for US-based educators, or other custom arrangements. Go to the resource provider to see their individual restrictions.