Heart of the Harvest: GoPro POV Perspective of Migrant Harvesting
Previewing New Knowledge: Where do our nation's immigrants come from?
Ask Students to Predict:
Before providing students with immigration facts, ask them to take a moment of think time and predict what countries they think that the most U.S. immigrants come from today? Ask them to share out, while drawing out elaborations such as, 'What makes you think this?' to extend thinking. Conversely, ask students to think about what countries they believe most immigrants came to the U.S. from 100 years ago in 1914? Again, ask them what makes them think this and what sources may have influenced their predictions.
This can be a positive opportunity for students to share what they know. It may be from knowledge of their own family heritage or it may be from a movie that they saw. Regardless of the source, making a link between what they already know to what they are about to learn is a powerful tool for making connections.
Providing Facts and Guidance:
Teacher can share the following facts with the class. (Present in chunks, allowing for processing time for students to interact with this new knowledge.)
How do today's top source countries compare to those 50 years ago?
In 2012, Mexican-born immigrants accounted for approximately 28 percent of the nearly 40.8 million foreign born in the United States, making them by far the largest immigrant group in the country. India was the second largest, closely followed by the China (including Hong Kong but not Taiwan), and the Philippines (each accounting for about 5 percent). El Salvador, Vietnam, Cuba, and Korea (each 3 percent), as well as the Dominican Republic and Guatemala (2 percent each), also were among the top ten countries of origin. Together, immigrants from these ten countries made up close to 60 percent of the U.S. immigrant population in 2012.
The predominance of immigrants from Latin American and Asian countries in the late 20th and early 21st centuries starkly contrasts with the trend seen in 1960 when immigrants tended to be from European countries. Italian-born immigrants made up 13 percent of all foreign born in 1960, followed by those born in Germany and Canada (accounting for about 10 percent each). In 1960s no single country accounted for more than 15 percent of the total immigrant population.[3]
Stopping Point:
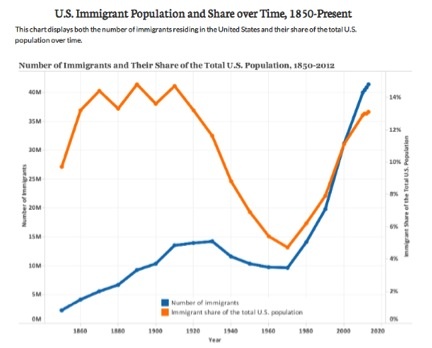
Show students the graph attached below as ask them to verbalize what they see in the data. Then after students have think and talk time, examine the graph further to point out the trends and changes over time in immigration and population.
Note:
The term "immigrants" (also known as the foreign born) refers to people residing in the United States who were not U.S. citizens at birth. This population includes naturalized citizens, lawful permanent residents (LPRs), certain legal nonimmigrants (e.g., persons on student or work visas), those admitted under refugee or asylee status, and persons illegally residing in the United States.[4]
Interact with Polulation Profiles
Student Activity (Can be used as a formative assessment):
While many immigrants in the U.S. are documented and legally authorized to work here, there are many others who are considered 'unauthorized' or 'illegal'. Ask students if they have heard about this topic in the news or current events? This can be an opportunity to see what students know or do not know.
Important Note: Rather than allowing the conversation to become an open-ended one, teacher should be purposeful in guiding the conversation toward investigation rather than debate. This unit of learning certainly could lead to a connection to debate, mathematics, economics, or even to art and music! Yet, center the conversation on gathering foundational knowledge through which to view the bulk of the unit, which is video portrait to increase understanding of social, cultural, and human experience.
Learn about the estimated 11.4 million unauthorized immigrants living in the United States.
- Where do they live?
- When did they arrive in the United States, and from which origin countries?
- What are their levels of education, top industries of employment, incomes, parental and marital status, health care coverage, and more?
- How many are potentially eligible for relief from deportation via deferred action?
Activity Tool:
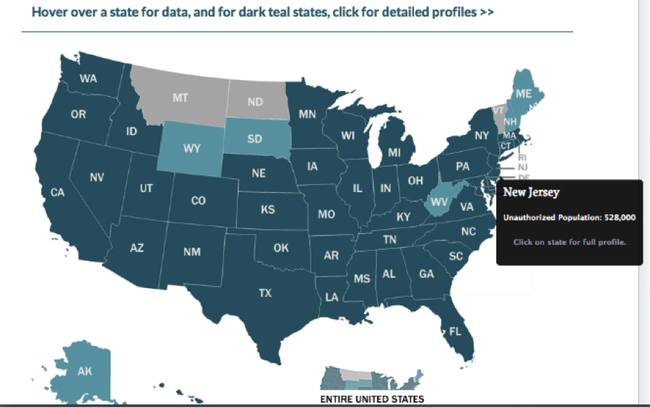
This data tool, based on a methodology that imputes unauthorized status using U.S. Census Bureau 2008-12 American Community Survey and 2008 Survey of Income and Program Participation data, provides estimates of unauthorized populations for the U.S., 47 states, and the District of Columbia. It also offers detailed sociodemographic profiles for the U.S., 41 states, and D.C.[5]
Click for the interactive Population Tool necessary for the following student activity.
Sample image below
Procedures:
Ask students to interact with the online tool and talk with a shoulder partner or team about points of data that seem interesting or intriguing to them. Why? What does the data indicate to you?
Have students hover over at least five different states (one at least from each general region of the US: north, south, east, west, central). Give students think time and talk time to interact with the tool. Monitor each group by engaging them in conversation about what they see. Ask them to make predictions as to what impact these data might have on the state's economy, productivity, culture, and more.
Finally, have each group click on the state in which you live. Have students create a Double Bubble Thinking Map comparing and contrasting their home state with another state of their choosing. Students must pay particular attention to include a comparison of the Workforce section of data for each state. This includes both Labor Force Participation and Top Industries of Employment.
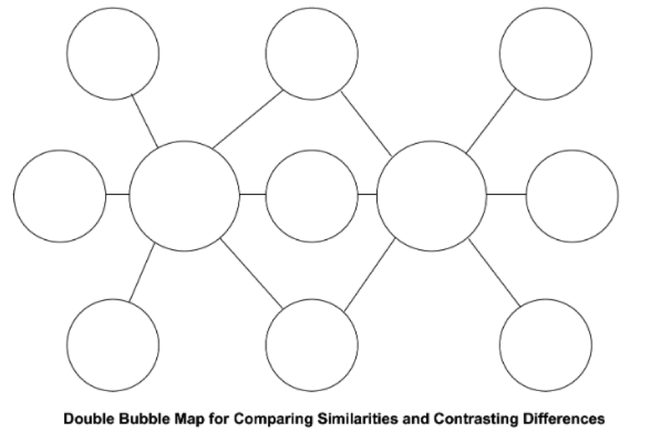
See the Double Bubble usage ideas in the document below.[6]
Have students prepare their visual representation and give a brief verbal overview of their findings to the rest of the class. At the end of this lesson, teacher should highlight any students who gave details about the state of New Jersey. Even if none wee shared, teacher should display the interactive population tool for the class and click on New Jersey. Examine the details particularly to Workforce. Share with students that this will be the place that they will journey to in the next few days as they get an up close view of the Heart of the Harvest.
Student Refection (Can be used as a formative assessment):
Ask students to do a journal write on the following prompts:
What do you think it would be like to immigrate to a new country? What would be the greatest challenges? What could be some reasons that you might choose to immigrate? What do you think you would do for work or school in this new place?