Lesson:
Design Proposal
Part 1: Lesson Description
Lesson Title: Using hours of the day to learn fractions with graphs - Remix
Learn fractions through graphing.
Abstract
Using adult learning theory and real world examples, learners will use graphing to understand fractions. Learners will be able to intrepret fractions and will be able to use fractions to interact with math in the real world.
Learner Audience / Primary Users
Adult learners working on level B math skills, who already have mastered level A (CCRS).
Educational Use
Curriculum/Instruction
Language
English
Material Type
Instructional Material
Keywords
Designers for Learning, Adult Education, Fractions, Graphing
Time Required for Lesson
50 Minutes
Targeted Skills:
- time management, money management, life
Learning Objectives
- At the end of this instruction, learners should be able to: easily utilize visual bar graph or pie graph in order to solve three basic arithmetic problems involving fractions.
College & Career Readiness Standards (CCRS) Alignment
The Lesson is designed to align with the following Standards:
Mathematics Level B: Understand a fraction 1/b as the quantity formed by 1 part when a whole is partitioned into b equal parts; understand a fraction a/b as the quantity formed by a parts of size 1/b. (3.NF.1)
Recognize and generate simple equivalent fractions, e.g., 1/2 = 2/4, 4/6 = 2/3. Explain why the fractions are equivalent, e.g., by using a visual fraction model. (3.NF.3b)
Compare two fractions with the same numerator or the same denominator by reasoning about their size. Recognize that comparisons are valid only when the two fractions refer to the same whole. Record the results of comparisons with the symbols >, =, or
Prior Knowledge
- Learners will need to have prior knowledge of base 10 number system, addition, subtraction, and representing and interpreting data, all of which is covered in Level A.
Required Resources
- Lesson plan
- laptop computers for instructor and students
- ability to present PowerPoint presentation
- calculator (optional)
- iPhone, iPad for optional graph making included in handout instructions
Lesson Author & License
Author: Cheryl Keener
License: Creative Commons CC BY 4.0 license
Part 2: Lesson
Warm-Up
Using a graph to answer questions
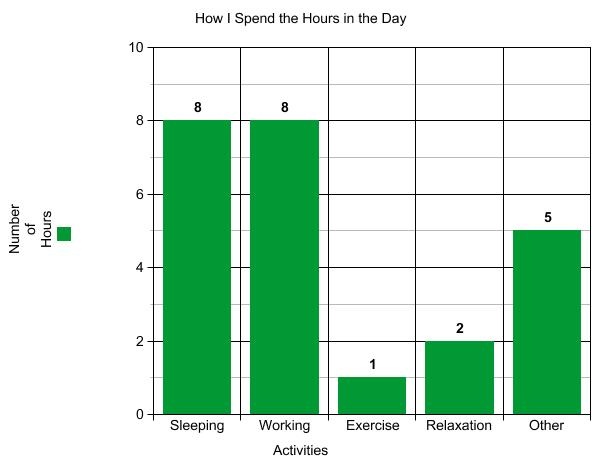
A graph of how I use the hours in my day.
Questions:
1) How many hours do I sleep each day?
2) What does this graph measure?
3) How many total hours each day are represented in this graph?
Time: 3 mins
Introduction
Define fraction with example, explain how graphing can help visualize fractions.
Time: 5 mins
"A fraction is a part of a whole. The top number is how many parts of the whole, and the bottom number is how many parts the whole is divided into."
3/4 = 3 parts of a whole divided into four parts.
1/2 = 1 part of a whole divided into two parts.
The formula for a fraction would look like: x/y = x part(s) of a whole divided into y part(s).
If we look at our graph above again, we can use the total number of hours as "y" (the bottom number) and each bar as a different "x" (number of those parts).
For example, Exercise = 1, the total number of hours is 24, so, Exercise's fraction is 1/24.
Presentation / Modeling / Demonstration
Demonstrate how to do math with fractions using a graph
Time: 20 minutes
Use PowerPoint to demonstrate how technology can create graphs that demonstrate fractions.
If the denominators (bottom numbers) are not the same, we would need to make them the same.
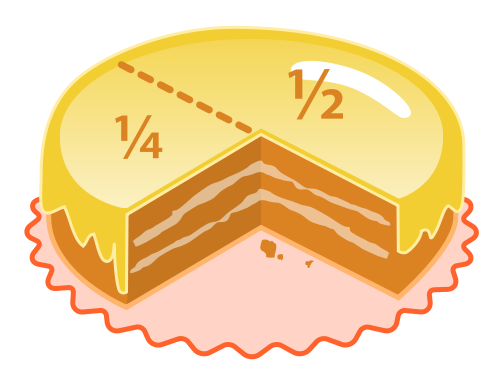
Cake
Looking at the image of the cake, you can see 1/2 and 1/4 markings. Remember, 1/2 means one of two parts (the whole was divided in 2, and the 1/2 part is one of those). 1/4 means one of four parts (the whole was divided in 4, and the 1/4 is one of those).
In order to subtract or add these two parts, we need to make the denominators the same. To do this, we need to change 1/2 to have a denominator of 4. We do this by multiplying it by 2. We multiply the numerator and the denominator by 2 ((1x2)/(2x2) = 2/4) and end up with 2/4. Now we can add the 1/4 + 2/4 = 3/4 (how much cake we have left!).
Guided Practice
Have the learner solve math problems using fractions with graphical data.
Time: 7 mins
1) Using the original graph of the hours of the day, add together sleep + work. What fraction of the day have we accounted for?
Hint: the denominators should all be the same already.
2) Once you have your answer, simplify it by finding numbers you can divide both the numerator and the denominator by (the opposite of how we change 1/2 to 2/4 in order to do addition).
Example: 4/12 = 1/3 (because you divide by 4). We do this in order to more easily understand how the fractions apply to our lives. We are much more likely to use 1/2 than 16/32!!
Continuing to use the original graph, how many more hours did you sleep than relax? Can this number be simplified too?
Evaluation
Have user create graph relevant to their life, and solve a math problem using the graphical data
Time: 15 mins
Create a graph that is relevant to your own life using the computer tool we learned to use in class.
Examples: How you spend money (x axis: what you spend it on, y axis: how much you spend); Amount of gas left in your car (x axis: day of the week, y axis: amount of gas); How many days a month you do certain activities (x axis: activities, y axis: number of days). Want to try doing a pie graph? Instructions are included in the handout. Instructor has a simple budget you can use.
Represent one of the items you are measuring as a fraction such as housing (if you are using the budget).
What number will be in you denominator (the bottom fraction number). How did you determine this?
Add two ore more of the items to determine how much of the whole they represent. Can they be simplified? Explain your answer "I spend 1/5 of my monthly income on personal, transportation, health and entertainment costs"
Subtract one item from another in order to represent how much more one is than the other. Explain your answer. " I spend $50 more for personal items than transportation which represents 1/70 of my budget."
Email graph and calculations to the instructor. Use complete sentences to describe your calculations.
Application
The introduction will explain how dividing things equally like hours in the day can be useful, and will equate this to fractions.
The presentation will show how to use the graph they used before to create and use fractions. The objective will be stated as: to show you how you can use fractions to understand planning your day.
Guided Practice: Show them how to do the activity, then have them do a similar problem. This will still be hours of the day.
Evaluation: Have them answer a similar question to above, using a graph, but use bus fare.
Assessment: Have them create a graph with something else. (offer help button - with suggestions). Have them create a math problem (real life) they can solve using the graphical data. Ask them what they found challenging or useful about the activity.
Key Terms and Concepts
Fractions, Graphing
Part 3: Supplementary Resources & References
Supplementary Resources
A website with an interactive pizza graphic to show fractions!
https://www.mathsisfun.com/definitions/fraction.html
https://www.onlinecharttool.com/graph
References
None for now
Attribution Statements
None for now