Distant Nature: Astronomy Exercises
Objectives
This exercise will demonstrate the relationships between Luminosity (also Absolute Magnitude) and Spectral Type (also Surface Temperature) for many different stars, as well as the relationship of these stars to our Sun. This will be accomplished through the construction of an H-R Diagram from stellar data for some of the nearest stars to the Sun and some of the brightest stars as seen from Earth.
Equipment/Materials Needed
Stellarium, Calculator, Colored pencils (3 different, dark colors).
Subject Introduction
- The
H-R diagram, named for Ejnar Hertzsprung and Henry Norris Russell, is one
of the most useful tools in stellar astronomy. Hertzsprung and Russell
decided to compare stars by a graphical representation of many stars’
luminosities and their spectral classes. Spectral class is related to a
star’s surface temperature and hence it’s color, while the luminosity is the total energy
output of a star and is related to its absolute magnitude.
The diagram(s) are used in the classification of stars, and give insights into the evolution of stars. This exercise has you construct an H-R diagram containing information on the brightest (apparent magnitude) and neatest stars with respect to our solar system. From the diagram, you will then be asked to answer several questions about those stars in relation to the two groups and each other.
Spectral classes are labeled using the letters, O B A F G K M (Oh Be A Fine Girl [or Guy] Kiss Me), with each subdivided into 10 minor divisions, spectral types (e.g. F0, F1, F2, …, F9, G0, etc.). Table 1 summarizes information concerning the major spectral classes/types of stars.
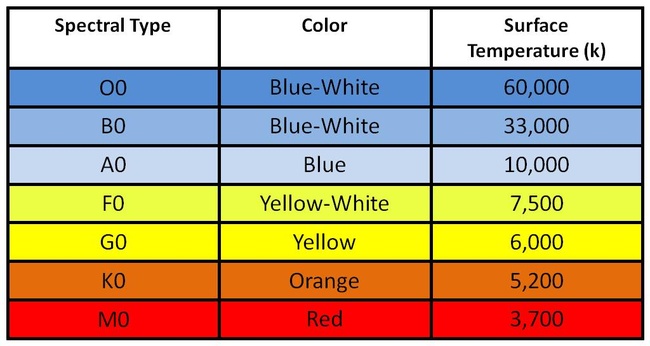
Table 1.
Figure 1 shows a basic H-R Diagram for reference.
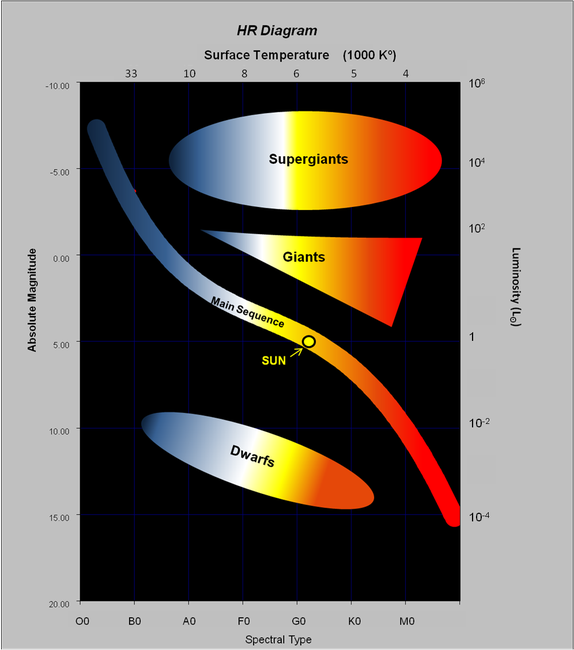
Figure 1.