Students compare traditional paper-based techniques associated with estimating areal precipitation, watershed delineation, …
Students compare traditional paper-based techniques associated with estimating areal precipitation, watershed delineation, and modeling evapotranspiration. This assignment challenges students to consider the various assumptions involved with both analog and digital analyses and highlights the strengths and weaknesses of both approaches.
In this lab we take a brief field trip to Adena Brook, …
In this lab we take a brief field trip to Adena Brook, a first order tributary of the Olentangy River in central Ohio. We observe the stream, its setting, its bedrock, determine some stream velocity profiles, and measure some basic chemical and physical properties of the stream water.
(Note: this resource was added to OER Commons as part of a batch upload of over 2,200 records. If you notice an issue with the quality of the metadata, please let us know by using the 'report' button and we will flag it for consideration.)
This unit introduces the hydrological cycle to provide context for the module …
This unit introduces the hydrological cycle to provide context for the module as a whole. It particularly focuses on those portions of the hydrological cycle that take place on land and that form the basis for water that is used by society. Students conduct a stakeholder analysis to better understand societal issues around water. Then the scientific exercise of the unit emphasizes quantitative approaches to describing the critical portions that humans have access to: surface water and shallow ground water. Students calculate residence times and fluxes between reservoirs and track water particles on an annual basis. They also explore available data sets for specific reservoirs such as snowpack and rivers.
Show more about Online Teaching suggestions Hide Online-adaptable: This exercise could be converted to online whole-class discussions/lectures and a breakout group activity. Would be best done synchronously.
(Note: this resource was added to OER Commons as part of a batch upload of over 2,200 records. If you notice an issue with the quality of the metadata, please let us know by using the 'report' button and we will flag it for consideration.)
This video demonstrates students measuring the alkalinity of a water sample, using …
This video demonstrates students measuring the alkalinity of a water sample, using an alkalinity test kit. The resource includes a video and a written transcript, and is supported by the Alkalinity Protocol in the GLOBE Teacher's Guide. This is one of seven videos on hydrology in a 24-part instructional video series describing scientific protocols used by GLOBE (Global Learning and Observation to Benefit the Environment), a worldwide, hands-on, K-12 school-based science education program.
This lesson will begin by introducing students to the impact of the …
This lesson will begin by introducing students to the impact of the interaction of the hydrologic and rock cycles on Earth's materials. Students will categorize the mechanical and chemical impacts of the hydrologic cycle on Earth's lithosphere using a jot chart. Students will participate in an outdoor geologic field study to locate examples of mechanical and chemical effects of the hydrologic cycle on their school's grounds. Lastly, students will analyze and interpret the data gathered during the geologic field study through the creation of a bar and circle graph. This lesson results from a collaboration between the Alabama State Department of Education and ASTA.
This assignment is best presented in two lab periods to represent the …
This assignment is best presented in two lab periods to represent the "before" and "after" scenarios of land use and their impact on hydrology. It requires documentation in map and/or airphoto form of land use in a specific watershed at two times: historical and modern. Historical USGS topographic maps from the 19th century were used in this case, along with digital orthophotos for the modern-day scenario. Some means of quantifying subareas within the watershed is also needed, either using software (ArcGIS) or transparent overlays and boxcounting from a translucent grid would work. For each of the sets of documentation: historical and modern, the students follow the USDA-NRCS TR55 empirical procedure to estimate event runoff depths and peak estimated discharge from the watershed. An area-weighted curve number (CN) is calculated based on tabulated categories of land use. Some judgment is involved in adapting the tabulated land use categories to the specific watershed used, and selecting an appropriate statistical average rainfall event to use. The sum of Darcy's Law calculations of discharge along streamtubes to a surface stream or estuary provides a groundwater discharge value over time for comparison. Each of these parts of the activity provides opportunities for the instructor to discuss uncertainties and sources of error. Note that although software allowing TR-55 analysis exists, it is simpler and more instructive to have students use the paper method and forms in the manual.
(Note: this resource was added to OER Commons as part of a batch upload of over 2,200 records. If you notice an issue with the quality of the metadata, please let us know by using the 'report' button and we will flag it for consideration.)
This video introduces the measurement of dissolved oxygen in a water body …
This video introduces the measurement of dissolved oxygen in a water body as an important indicator of ecosystem health, and demonstrates students analyzing a water sample for dissolved oxygen. The resource includes a video and a written transcript, and is supported by the Dissolved Oxygen Protocol in the GLOBE Teacher's Guide. This is one of seven videos on hydrology in the 24-part instructional video series describing scientific protocols used by GLOBE (Global Learning and Observation to Benefit the Environment), a worldwide, hands-on, K-12 school-based science education program.
There is broad interest to improve the reproducibility of published research. We …
There is broad interest to improve the reproducibility of published research. We developed a survey tool to assess the availability of digital research artifacts published alongside peer-reviewed journal articles (e.g. data, models, code, directions for use) and reproducibility of article results. We used the tool to assess 360 of the 1,989 articles published by six hydrology and water resources journals in 2017. Like studies from other fields, we reproduced results for only a small fraction of articles (1.6% of tested articles) using their available artifacts. We estimated, with 95% confidence, that results might be reproduced for only 0.6% to 6.8% of all 1,989 articles. Unlike prior studies, the survey tool identified key bottlenecks to making work more reproducible. Bottlenecks include: only some digital artifacts available (44% of articles), no directions (89%), or all artifacts available but results not reproducible (5%). The tool (or extensions) can help authors, journals, funders, and institutions to self-assess manuscripts, provide feedback to improve reproducibility, and recognize and reward reproducible articles as examples for others.
In this activity, students model the impact of land-cover changes on stormwater …
In this activity, students model the impact of land-cover changes on stormwater runoff using the EPA's National Stormwater Calculator (Calculator). The students are introduced to the Calculator through a tutorial. Students are provided with a particular site -- a residential neighborhood -- and model two land-use scenarios associated with it: (1) a pre-expansion scenario that includes current forest and developed land cover, and (2) a post-expansion scenario, under which the forest cover will be developed as low-intensity residential.
(Note: this resource was added to OER Commons as part of a batch upload of over 2,200 records. If you notice an issue with the quality of the metadata, please let us know by using the 'report' button and we will flag it for consideration.)
This video provides a step-by-step guide to determining nitrate and nitrite concentrations …
This video provides a step-by-step guide to determining nitrate and nitrite concentrations in a water sample, using a nitrate testing kit. It describes what chemical reactions are taking place throughout the testing process. The resource includes a video and a written transcript, and is supported by the Nitrate Protocol in the GLOBE Teacher's Guide. This is one of seven videos on hydrology in the 24-part instructional video series describing scientific protocols used by GLOBE (Global Learning and Observation to Benefit the Environment) a worldwide, hands-on, K-12 school-based science education program.
The video is a procedural guide to sampling salinity measurements in water …
The video is a procedural guide to sampling salinity measurements in water bodies in the field. It provides a step-by-step explanation of field procedures and features students conducting the investigation and asking questions about what changes in salinity could indicate in rivers, lakes, and estuaries. The resource includes a video, transcript, and is supported by the Salinity Protocol in the GLOBE Teacher's Guide. This is one of seven videos on hydrology in the 24-part instructional video series describing scientific protocols used by GLOBE (Global Learning and Observation to Benefit the Environment), a worldwide, hands-on, K-12 school-based science education program.
This video demonstrates students measuring the acidity of water, using pH indicator …
This video demonstrates students measuring the acidity of water, using pH indicator paper and a pH meter. The resource includes a video and a written transcript, and is supported by the Water pH Protocol in the GLOBE Teacher's Guide. This is one of seven videos on hydrology in the 24-part instructional video series describing scientific protocols used by GLOBE (Global Learning and Observation to Benefit the Environment), a worldwide, hands-on, K-12 school-based science education program.
The video is a procedural guide to sampling electrical conductivity measurements in …
The video is a procedural guide to sampling electrical conductivity measurements in water bodies using standardized GLOBE protocols. It provides a step-by-step explanation of the field procedure and features students conducting the investigation and asking questions about measuring electrical conductivity and what these measurements mean with respect to water impurities and dissolved solids. The resource includes a video, transcript, and is supported by the Electrical Conductivity Protocol in the GLOBE Teacher's Guide. This is one of seven videos on hydrology in the 24-part instructional video series describing scientific protocols used by GLOBE (Global Learning and Observation to Benefit the Environment) a worldwide, hands-on, K-12 school-based science education program.
Students learn about the Earth's water cycle, especially about evaporation. Once a …
Students learn about the Earth's water cycle, especially about evaporation. Once a dam is constructed, its reservoir becomes a part of the region's natural hydrologic cycle by receiving precipitation, storing runoff water and evaporating water. Although almost impossible to see, and not as familiar to most people as precipitation, evaporation plays a critical role in the hydrologic cycle, and is especially of interest to engineers designing new dams and reservoirs, such as those that Splash Engineering is designing for Thirsty County.
How does water move throughout the Earth system? How do scientists measure …
How does water move throughout the Earth system? How do scientists measure the amount of water that moves through these pathways? This unit provides an alternative way for students to learn the major components of Earth's water cycle, which includes actively thinking about how we measure the water system. In this unit, students annotate a schematic diagram to identify the major reservoirs and fluxes in the hydrosphere. They also work in teams of different "experts" to identify traditional and geodetic techniques that are used to measure components of the hydrosphere and the changes over time. Using their recently acquired knowledge about these techniques, they make inferences about which methods are best for measuring different components of the hydrosphere. Measurement methods include stream gauges, groundwater wells, snow pillows, vertical GPS changes, reflection GPS for snow depth, and GRACE satellite (Gravity Recovery and Climate Experiment).
Show more about Online Teaching suggestions Hide Online-adaptable: Main exercise is a jigsawactivity that could be done in an online course but student groups with online collaboration (probably synchronous) would need to be organized OR the exercise would need to be adapted away from group format.
(Note: this resource was added to OER Commons as part of a batch upload of over 2,200 records. If you notice an issue with the quality of the metadata, please let us know by using the 'report' button and we will flag it for consideration.)
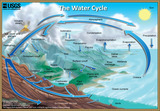
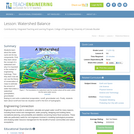
Title image "The Natural Water Cycle" by Howard Perlman and John Evans …
Title image "The Natural Water Cycle" by Howard Perlman and John Evans of the United States Geological Survey is in the Public Domain. Did you have an idea for improving this content? We’d love your input.
Students learn about the water cycle and its key components. First, they …
Students learn about the water cycle and its key components. First, they learn about the concept of a watershed and why it is important in the context of engineering hydrology. Then they learn how we can use the theory of conservation of mass to estimate the amount of water that enters a watershed (precipitation, groundwater flowing in) and exits a watershed (evaporation, runoff, groundwater out). Finally, students learn about runoff and how we visualize runoff in the form of hydrographs.
In this activity, students act as water molecules and travel through parts …
In this activity, students act as water molecules and travel through parts of the water cycle (ocean, atmosphere, clouds, glaciers, snow, rivers, lakes, ground, aquifer). Students use a diagram of the hydrologic cycle to draw the pathway they traveled.
This activity was developed to give participants an understanding of Earth's water …
This activity was developed to give participants an understanding of Earth's water cycle by completing a WebQuest and building a model of the water cycle.
No restrictions on your remixing, redistributing, or making derivative works. Give credit to the author, as required.
Your remixing, redistributing, or making derivatives works comes with some restrictions, including how it is shared.
Your redistributing comes with some restrictions. Do not remix or make derivative works.
Most restrictive license type. Prohibits most uses, sharing, and any changes.
Copyrighted materials, available under Fair Use and the TEACH Act for US-based educators, or other custom arrangements. Go to the resource provider to see their individual restrictions.