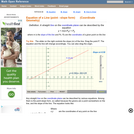
This is a task from the Illustrative Mathematics website that is one …
This is a task from the Illustrative Mathematics website that is one part of a complete illustration of the standard to which it is aligned. Each task has at least one solution and some commentary that addresses important asects of the task and its potential use. Here are the first few lines of the commentary for this task: Anna and Jason have summer jobs stuffing envelopes for two different companies. Anna earns \$14 for every 400 envelops she finishes. Jason earns \$9 fo...
This lesson unit is intended to help teachers assess how well students …
This lesson unit is intended to help teachers assess how well students are able to create and solve linear equations. In particular, the lesson will help you identify and help students who have the following difficulties: solving equations with one variable and solving linear equations in more than one way.
This lesson unit is intended to help teachers assess how well students …
This lesson unit is intended to help teachers assess how well students are able to classify solutions to a pair of linear equations by considering their graphical representations. In particular, this unit aims to help teachers identify and assist students who have difficulties in: using substitution to complete a table of values for a linear equation; identifying a linear equation from a given table of values; and graphing and solving linear equations.
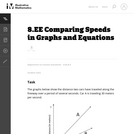
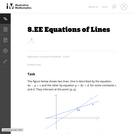
This task provides the opportunity for students to reason about graphs, slopes, …
This task provides the opportunity for students to reason about graphs, slopes, and rates without having a scale on the axes or an equation to represent the graphs. Students who prefer to work with specific numbers can write in scales on the axes to help them get started.
Learn to connect position-time and velocity-time graphs. Explore velocity using an animated …
Learn to connect position-time and velocity-time graphs. Explore velocity using an animated car icon connected to either a position-time or a velocity-time graph, or both. Then investigate other motion graphs.
Students gain a basic understanding of the properties of media soil, sand, …
Students gain a basic understanding of the properties of media soil, sand, compost, gravel and how these materials affect the movement of water (infiltration/percolation) into and below the surface of the ground. They learn about permeability, porosity, particle size, surface area, capillary action, storage capacity and field capacity, and how the characteristics of the materials that compose the media layer ultimately affect the recharging of groundwater tables. They test each type of material, determining storage capacity, field capacity and infiltration rates, seeing the effect of media size on infiltration rate and storage. Then teams apply the testing results to the design their own material mixes that best meet the design requirements. To conclude, they talk about how engineers apply what students learned in the activity about the infiltration rates of different soil materials to the design of stormwater management systems.
An interactive applet and associated web page that demonstrate the equation of …
An interactive applet and associated web page that demonstrate the equation of a line in point-slope form. The user can move a slider that controls the slope, and can drag the point that defines the line. The graph changes accordingly and equation for the line is continuously recalculated with every slider and / or point move. The grid, axis pointers and coordinates can be turned on and off. The equation display can be turned off to permit class exercises and then turned back on the verify the answers. The applet can be printed as it appears on the screen to make handouts. The web page has a full description of the concept of the equation of a line in point - slope form, a worked example and has links to other pages relating to coordinate geometry. Applet can be enlarged to full screen size for use with a classroom projector. This resource is a component of the Math Open Reference Interactive Geometry textbook project at http://www.mathopenref.com.
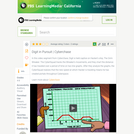
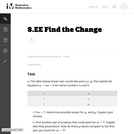
This task requires students to use the fact that on the graph …
This task requires students to use the fact that on the graph of the linear equation y=ax+c, the y-coordinate increases by a when x increases by one. Specific values for c and d were left out intentionally to encourage students to use the above fact as opposed to computing the point of intersection, (p,q), and then computing respective function values to answer the question.
This lesson unit is intended to help teachers assess how well students …
This lesson unit is intended to help teachers assess how well students are able to: estimate lengths of everyday objects; convert between decimal and scientific notation; and make comparisons of the size of numbers expressed in both decimal and scientific notation.
This task helps students solidify their understanding of linear functions and push …
This task helps students solidify their understanding of linear functions and push them to be more fluent in their reasoning about slope and y-intercepts. This task has also produced a reasonable starting place for discussing point-slope form of a linear equation.
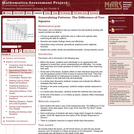
This lesson unit is intended to help you assess how well students …
This lesson unit is intended to help you assess how well students working with square numbers are able to: choose an appropriate, systematic way to collect and organize data, examining the data for patterns; describe and explain findings clearly and effectively; generalize using numerical, geometrical, graphical and/or algebraic structure; and explain why certain results are possible/impossible, moving towards a proof.
In Module 4, students extend what they already know about unit rates …
In Module 4, students extend what they already know about unit rates and proportional relationships to linear equations and their graphs. Students understand the connections between proportional relationships, lines, and linear equations in this module. Students learn to apply the skills they acquired in Grades 6 and 7, with respect to symbolic notation and properties of equality to transcribe and solve equations in one variable and then in two variables.
Find the rest of the EngageNY Mathematics resources at https://archive.org/details/engageny-mathematics.
Students learn about the anatomy of the ear and how the ears …
Students learn about the anatomy of the ear and how the ears work as a sound sensor. Ear anatomy parts and structures are explained in detail, as well as how sound is transmitted mechanically and then electrically through them to the brain. Students use LEGO® robots with sound sensors to measure sound intensities, learning how the NXT brick (computer) converts the intensity of sound measured by the sensor input into a number that transmits to a screen. They build on their experiences from the previous activities and establish a rich understanding of the sound sensor and its relationship to the TaskBot's computer.
Students will use ratios to demonstrate the connections between proportional relationships, lines, …
Students will use ratios to demonstrate the connections between proportional relationships, lines, and linear equations. Students will solve problems using a cooperative, kinesthetic activity in which they will create a ratio table, then graph proportional relationships with their bodies to demonstrate that the ratio (or rate) is the slope that will always pass through the origin.
No restrictions on your remixing, redistributing, or making derivative works. Give credit to the author, as required.
Your remixing, redistributing, or making derivatives works comes with some restrictions, including how it is shared.
Your redistributing comes with some restrictions. Do not remix or make derivative works.
Most restrictive license type. Prohibits most uses, sharing, and any changes.
Copyrighted materials, available under Fair Use and the TEACH Act for US-based educators, or other custom arrangements. Go to the resource provider to see their individual restrictions.