Updating search results...

Search Resources

69 Results

View
Selected filters:
  • volcanoes
Plate Tectonics II: Plates, plate boundaries, and driving forces
Read the Fine Print
Educational Use
Rating
0.0 stars

The distribution of earthquakes and volcanoes around the world confirmed the theory of plate tectonics first proposed by Wegener. These phenomena also help categorize plate boundaries into three different types: convergent, divergent, and transform.

Subject:
Astronomy
Chemistry
Education
Geology
Geoscience
Physical Science
Physics
Space Science
Material Type:
Interactive
Unit of Study
Provider:
UCAR Staff
Provider Set:
Visionlearning
Author:
Anne Egger
Date Added:
03/18/2003
Plate Tectonics: The Hawaiian Archipelago
Read the Fine Print
Educational Use
Rating
0.0 stars

This video segment adapted from NOVA uses animation to show the relationship between the movement of a tectonic plate and whether volcanoes on the Hawaiian Islands are active or dormant.

Subject:
Astronomy
Chemistry
Education
Geology
Geoscience
Physical Science
Physics
Space Science
Material Type:
Activity/Lab
Diagram/Illustration
Provider:
PBS LearningMedia
Provider Set:
PBS Learning Media: Multimedia Resources for the Classroom and Professional Development
Author:
National Science Foundation
WGBH Educational Foundation
Date Added:
10/21/2005
Tectonic Plates, Earthquakes, and Volcanoes
Read the Fine Print
Educational Use
Rating
0.0 stars

This interactive activity produced for Teachers' Domain shows the relationship between tectonic boundaries and the locations of earthquake events and volcanoes around the world.

Subject:
Astronomy
Chemistry
Education
Geology
Geoscience
Physical Science
Physics
Space Science
Material Type:
Activity/Lab
Data Set
Diagram/Illustration
Interactive
Provider:
PBS LearningMedia
Provider Set:
PBS Learning Media: Multimedia Resources for the Classroom and Professional Development
Author:
National Science Foundation
WGBH Educational Foundation
Date Added:
12/17/2005
VEPP: A guided inquiry - Three months in the life of a volcano
Conditional Remix & Share Permitted
CC BY-NC-SA
Rating
0.0 stars

This is an exercise that is in development and has not yet been fully tested in the classroom. Please check back regularly for updates and changes.

This guided inquiry will investigate the three month phase of activity in the vicinity of Pu`u `O`o and the summit region (June 1, 2007 -- August 30, 2007).
Students will examine already prepared monitoring data derived from the VEPP website (GPS, tilt and seismic), and, with guidance, discover what other information is available to understand and speculate on the nature of the activity, including webcams, videos, still images, maps, and press releases.
Full length description:
Prior to doing this introductory laboratory exercise, students should be introduced to the basic instruments used in volcano monitoring. Before class, students will be provided with an assignment to reinforce their understanding about the techniques used in volcano monitoring.

During lab, students (in small groups) will be provided with the data files from a three month period of time in the vicinity of Pu`u `O`o and the summit region (June 1, 2007 -- August 30, 2007) (GPS, RSAM and Tilt) at the start of the exercise. The data files are provided under Instructor Materials below.
A worksheet will be provided to the students to guide them through the initial investigation of the graphs. Example questions include: What is the data showing in each of the graphs? Are there any specific events that are evident in your graph? As a group, can you determine if the events seen in one graph correlate to events seen in any of the other graphs? A discussion of what data the graphs are illustrating will be facilitated by the instructor.

Once students have examined and understand what the data is showing, they will propose hypotheses to explain the observed data trends and correlations. Through just-in-time teaching (JiTT), students will be provided with or guided to further information that may assist them in discovering the nature of the activity. For example, they can request to see maps, videos, webcams, and images of the area during the three-month period spanned by the exercise.
Materials for implementing this laboratory are provided for instructors and students (forthcoming).

(Note: this resource was added to OER Commons as part of a batch upload of over 2,200 records. If you notice an issue with the quality of the metadata, please let us know by using the 'report' button and we will flag it for consideration.)

Subject:
Biology
Life Science
Material Type:
Activity/Lab
Provider:
Science Education Resource Center (SERC) at Carleton College
Provider Set:
Teach the Earth
Author:
Jennifer Thomson
Date Added:
04/05/2022
VEPP: Determining the relationship between the summit and Pu'u 'O'o on Kilauea
Conditional Remix & Share Permitted
CC BY-NC-SA
Rating
0.0 stars

This is an exercise that is in development and will not be fully tested until Fall 2010. Please check back regularly for updates and changes.
Brief three-line description of the activity or assignment and its strengths:
Students first learn about several volcanic monitoring techniques. Given three hypotheses on the movement of magma in the plumbing between the summit and Pu'u 'Ō'ō on Kilauea, students make predictions about what they would expect to see for each hypothesis in the data. They then analyze the data and test each hypothesis.

Full length description:

In this activity, students learn, using a balloon experiment and sketches, how the monitoring techniques of ground tilt and ground motion (using GPS) illustrate magma chamber inflation and deflation. Students also are briefly introduced to the varying composition of basalt lava.
Three hypotheses about the movement of magma between the Kilauea summit and Pu'u 'Ō'ō are given to the students. For each hypothesis, students make predictions about what they would expect to see with each monitoring technique. After making predictions, students are given handouts with the data from each technique, they analyze the data to evaluate each hypothesis, and they make a conclusion about the movement of magma beneath Kilauea.

(Note: this resource was added to OER Commons as part of a batch upload of over 2,200 records. If you notice an issue with the quality of the metadata, please let us know by using the 'report' button and we will flag it for consideration.)

Subject:
Biology
Life Science
Material Type:
Activity/Lab
Provider:
Science Education Resource Center (SERC) at Carleton College
Provider Set:
Teach the Earth
Author:
Karen Kortz
Date Added:
09/12/2020
VEPP: GPS data, vectors and volcano monitoring: an exercise for introductory geology students based on VEPP data
Conditional Remix & Share Permitted
CC BY-NC-SA
Rating
0.0 stars

Brief three-line description of the activity or assignment and its strengths (you will have an opportunity to expand on this description later in the form):

This exercise is designed to investigate continuous GPS data from sites around Pu'u'Oo. Students will analyze time series of displacement, create maps of displacement vectors and discuss implications of the data and potential as a volcano monitoring technique.Note: this exercise is currently in development and will not be implemented by the author until Spring 2011. Be aware that updates and changes may occur through this time.
Full length description:This activity is designed for freshman or sophomore level courses in Introductory Geology or Geological Hazards for non-majors. No prior math skills are assumed; the activity can be completed without prior knowledge of GPS data, volcano monitoring or Hawaiian geology. The activity can be completed in class as a lab activity or as a homework assignment. Students will complete a series of activities centered on GPS time-series data from Pu'u 'O'o. Following this activity, the VEPP site will be examined as a group in order to investigate GPS data relating to known magmatic episodes at Pu'u 'O'o.

Part 1: In-class activity (described in detail in class handout)

Examination of time series and computation of displacement and velocities.
Graphing of displacement vectors for identified time intervals and determination of actual motion vectors.
These activities are interspersed by guided questions.

Part 2: In-Class web-based evaluation of VEPP data.
Think-Pair-Share activity among whole class. Once students have looked at the Pu'u 'O'o data described in part 1 of the activity, the class as a whole will look at data corresponding to either up to the minute activity or known events in the past. Using skills they have developed in the activity, they will work in small groups to interpret the data on the fly, using the work they have done previously to guide them. This part of the activity will provide the basis for discussion and explanation of the activity over-all.

(Note: this resource was added to OER Commons as part of a batch upload of over 2,200 records. If you notice an issue with the quality of the metadata, please let us know by using the 'report' button and we will flag it for consideration.)

Subject:
Biology
Life Science
Material Type:
Activity/Lab
Provider:
Science Education Resource Center (SERC) at Carleton College
Provider Set:
Teach the Earth
Author:
Martha House
Date Added:
03/15/2022
VEPP: Hawaii Volcanoes National Park - A Restless Paradise
Conditional Remix & Share Permitted
CC BY-NC-SA
Rating
0.0 stars

This is an exercise that is in development and has not yet been fully tested in the classroom. Please check back regularly for updates and changes.

This activity is encompassed in a PowerPoint module (PowerPoint 6.1MB Oct1 10) with embedded Excel spreadsheets that will incorporate data and increase students' quantitative skills.

Brief three-line description of the activity or assignment and its strengths (you will have an opportunity to expand on this description later in the form):

This PowerPoint module is embedded with Excel spreadsheets and provides information about the geology of Hawai'i Volcanoes National Park. The core quantitative aspect of this module is graph interpretation. The module also requires students to convert units and solve the Pythagorean Theorem.

Full length description:This PowerPoint module introduces students to the geology and current volcanic activity at Hawai'i Volcanoes National Park in conjunction with the Volcanoes Exploration Program:Puu Oo (VEPP) project. The module briefly covers the geologic setting and evolution of a hot spot island chain, monitoring techniques, historical eruptions, and hazards. Along the way, students complete short, ad hoc spreadsheets to answer questions regarding visual observations of an earthquake map and determining latitude and longitude, finding the highest and lowest concentrations of SO2 gas from graphed data, interpreting tiltmeter graphs, solving the Pythagorean Theorem to determine distance between GPS stations, making visual observations from webcam images, and converting units for eruption volumes.

(Note: this resource was added to OER Commons as part of a batch upload of over 2,200 records. If you notice an issue with the quality of the metadata, please let us know by using the 'report' button and we will flag it for consideration.)

Subject:
Biology
Life Science
Material Type:
Activity/Lab
Provider:
Science Education Resource Center (SERC) at Carleton College
Provider Set:
Teach the Earth
Author:
Judy McIlrath
Judy McIlrath McIlrth
Date Added:
09/29/2022
VEPP: Monitoring Pu'u O'o
Conditional Remix & Share Permitted
CC BY-NC-SA
Rating
0.0 stars

NOTE: This activity has NOT been attempted yet in class, and therefore still needs significant refinement. It will be updated once it has been developed further.

Brief three-line description of the activity or assignment and its strengths:
This is a two-part exercise. Part I is designed to train students in the technical use of the VEPP website and to train them to use observations from multiple datasets (GPS, tilt, seismic, physical behavior) to draw conclusions about the volcano's physical behavior. Part II involves a month-long monitoring exercise using real-time data from Pu'u O'o followed by interpretation of those data.
Full length description:
This is a two-part exercise. The main goal is to provide as realistic a volcano monitoring experience as possible given classroom constraints. Part I is designed to provide students with the ability to work with the VEPP website to generate plots of GPS, seismic, and tilt data, as well as access webcam images and make movies from them. In the process, they will be interpreting data from the July 21 2007 dike injection and eruption event and focusing on deformation concepts.

Part II is an exploratory exercise, with the goal of reproducing the monitoring process a volcanologist would use for this volcano. The students are going to be responsible for monitoring the behavior of Pu'u O'o for one month. This process entails gathering data on a daily basis (all available data sources: GPS, seismic, physical observations, tilt), so as to accumulate a month-long record of the behavior of the volcano. Each week they will have to produce a report summarizing the behavior of the volcano, including plots of all measurements with time and correlations between different variables (e.g., seismic events vs horizontal movement from GPS). At the end of the month, the final report will also include calculations about changes in magma volume and comparisons to estimates of erupted volume. Students will also address several interpretive questions, including: a) how does magma storage volume (calculated from deformation data) compare with eruptive volume over the same period; b) how do the various monitoring parameters relate to each other; c) how does the behavior of Pu'u O'o during the month they observed it compare to the July 2007 behavior they analyzed in Part I; and c) comparison of the fluctuations and magnitudes of Pu'u O'o measurements to other types of volcanoes.

(Note: this resource was added to OER Commons as part of a batch upload of over 2,200 records. If you notice an issue with the quality of the metadata, please let us know by using the 'report' button and we will flag it for consideration.)

Subject:
Biology
Life Science
Material Type:
Activity/Lab
Provider:
Science Education Resource Center (SERC) at Carleton College
Provider Set:
Teach the Earth
Author:
Karen Harpp
Date Added:
11/15/2016
VEPP: Monitoring the Pu'u 'Ō'ō Eruption of Kīlauea Volcano Using Geochemical, Deformation and Seismicity Timeseries Data
Conditional Remix & Share Permitted
CC BY-NC-SA
Rating
0.0 stars

Show credits
HidePu'u 'O'o at the end of episode 32 (USGS photograph by J.D. Griggs, 4/22/85, JG5363).
This is an exercise that is in development and has not yet been fully tested in the classroom. Please check back regularly for updates and changes.

Goals of this lab are to: (1) gain background on volcano monitoring using maps, photographs, and geochemical, deformation (tiltmeter) and seismic data from eruptive activity of the Pu'u 'Ō'ō eruption; (2) make and interpret geochemical, deformation and seismic data plots as part of a time-series analysis for particular intervals of eruptive activity; and (3) answer questions and discuss information about magmatic and structural processes associated with volcanism at Kīlauea Volcano.

Brief description of the activity

The current eruption of Kīlauea Volcano on the island of Hawai'i has been closely monitored and studied since its inception in 1983. This laboratory exercise utilizes the excitement of an ongoing eruption to demonstrate volcano monitoring, deformation, and magmatic processes to better understand an active hotspot volcano.

(Note: this resource was added to OER Commons as part of a batch upload of over 2,200 records. If you notice an issue with the quality of the metadata, please let us know by using the 'report' button and we will flag it for consideration.)

Subject:
Biology
Chemistry
Life Science
Physical Science
Material Type:
Activity/Lab
Provider:
Science Education Resource Center (SERC) at Carleton College
Provider Set:
Teach the Earth
Author:
Andrew R. Greene and Michael O. Garcia, University of Hawai'i at Mānoa
Date Added:
03/28/2018
VEPP: Part 1: Volcanic Hazards and Risk; Part 2: Monitoring an Active Volcano
Conditional Remix & Share Permitted
CC BY-NC-SA
Rating
0.0 stars

Please contact the author if you have questions, concerns or suggestions.

This is an applied in-class exercise designed to have students evaluate monitoring data. The students, broken into groups of 4, will describe, evaluate, and synthesize several monitoring datasets. They will come up with hypothesis for the data, which will be the basis for a class discussion.

(Note: this resource was added to OER Commons as part of a batch upload of over 2,200 records. If you notice an issue with the quality of the metadata, please let us know by using the 'report' button and we will flag it for consideration.)

Subject:
Biology
Life Science
Material Type:
Activity/Lab
Provider:
Science Education Resource Center (SERC) at Carleton College
Provider Set:
Teach the Earth
Author:
Brittany Brand
Date Added:
11/13/2019
VEPP: Using maps to assess volcanic geologic hazards
Conditional Remix & Share Permitted
CC BY-NC-SA
Rating
0.0 stars

This is an exercise that is in development and has not yet been fully tested in the classroom. Please check back regularly for updates and changes.

Students will use a combination of topographic and geologic maps in interpret and analyze natural hazards of the Pu'uO'o eruption.

Brief three-line description of the activity or assignment and its strengths:
Students will use a topographic map to plot the direction of lava flow associated with eruptive activity of Kilauea Volcano, in Hawaii. They will assess the natural hazards associated with Kilauea's eruptive and gas activity in order to make predictions and assess the dangers to people and properties in the region.

Full length description:

You are a HVO scientist who will be assessing the natural hazards associated with Kilauea's activity including the dangers to people and properties in the region. There are three parts to this lab assignment: a pre-lab, lab, and news report. The pre-lab should be completed before attending the lab. In the pre-lab you will be asked to look at the style of volcanism associated with Pu'u O'o cone, a cinder-and-spatter cone located in the east rift zone.
In the lab you will be provided with 3 topographic and 1 geologic map to assess the natural hazards associated with Kilauea's activity including the dangers to people and properties in the region. You will be responsible for creating your own set of maps and materials from the pre-lab and lab exercises.
The third part of the assignment involves writing an accompanying news report to communicate the results of your work to the public. While you are encouraged to discuss all parts of the assignment with your peers, you must hand in your own work.

(Note: this resource was added to OER Commons as part of a batch upload of over 2,200 records. If you notice an issue with the quality of the metadata, please let us know by using the 'report' button and we will flag it for consideration.)

Subject:
Biology
Life Science
Material Type:
Activity/Lab
Provider:
Science Education Resource Center (SERC) at Carleton College
Provider Set:
Teach the Earth
Author:
Brian Scheidt
Date Added:
06/22/2017
VEPP: Using volcano deformation data for lava flow hazard assessment and decision making, Part I: what do the instruments measure?
Conditional Remix & Share Permitted
CC BY-NC-SA
Rating
0.0 stars

This is an exercise that is in development and has not yet been fully tested in the classroom. Please check back regularly for updates and changes.

Brief three-line description of the activity or assignment and its strengths:
This is the first part of a loosely linked three part activity. Each part can be used as a stand-alone activity with slight modification. This part introduces students to volcano monitoring using data from tiltmeters and GPS receivers by means of a very simple in-class demonstration of volcanic inflation/deflation, followed by small group discussion of real data and their implications, followed by individual homework assignment based on VEPP data interpretation
Full length description:

The instructor conducts the in-class demonstration described below (demonstration takes about 20 minutes):

Put the wet sand in the tray (fill up to about three-quarters of the tray depth)
Bury the balloon in the sand. Attach the pump to the balloon.
Shape the sand above the balloon to mimic a volcano.
The balloon is the model of the magma chamber inside the volcano. While it stays relatively deflated, the "volcano" above it shows no major change in shape.
Air is then pumped in the balloon, mimicking an infusion of magma in the magma chamber. As the balloon begins to fill out, it expands, deforming the volcano above it.
The volcano is now "active" and should be "monitored" by different instruments, namely, tiltmeters, GPS, and seismometers. The carpenters' levels mimic "tiltmeters." At this point it might be useful to ask the students to select where the tiltmeters should be placed, making sure one is "tangential" and the other is "radial" (perpendicular to each other). This is a good place to start a discussion about inflation and deflation events and how those are measured by tiltmeters.
Once there is enough air in the balloon to create an obvious bulge in the volcano, the use of GPS receivers for measuring volcano deformation can be discussed. Two long pins can be used as two GPS stations and the changing distance between them can demonstrate how deformation can be measured in 3-D. At this point, several inflation-deflation events can be demonstrated by carefully letting air out of the balloon and pumping it back in.
This demonstration introduces different geophysical instruments used for volcano monitoring and provides a simplified illustration of how they work.
This demonstration is followed by a brief overview of the VEPP website and the type of data available there.
Whole class discussion about different data types (example: inflation-deflation events as recorded by tiltmeters over a specific time period). Instructor will lead the discussion and demonstrate how the data is manipulated on-line.

The VEPP overview takes 10-15 minutes
After the whole class discussion and demonstration by instructor, students break into small groups (3-4 people per group). Instructor provides printed data plots for tiltmeters and GPS time series for the same time period. A map showing the locations of the corresponding instruments is also provided. Different groups get data for different time periods/eruption events. An example plot with clearly marked inflation/deflation events and instructions about how to read the plots will be helpful
Questions for students to answer in small groups:

Identify the dates/times when tiltmeters record inflation events
Identify dates/times when tiltmeters record deflation events
What does the GPS data show for each of those time periods?
What can you infer about the volcanic activity for those time periods from the data provided?

Small group discussion takes 15-20 minutes
Each group report back and compare their interpretations. Instructor facilitates discussion/provides feedback (20 minutes)
Instructor then demonstrates the webcam images/movies from the VEPP site for the same time periods/events as the data provided to the student groups so they can see whether they interpreted the data correctly or not. This is followed by discussion about uncertainties/ambiguities associated with real data and data interpretation. (10-15 minutes).

(Note: this resource was added to OER Commons as part of a batch upload of over 2,200 records. If you notice an issue with the quality of the metadata, please let us know by using the 'report' button and we will flag it for consideration.)

Subject:
Biology
Life Science
Physical Science
Physics
Material Type:
Activity/Lab
Provider:
Science Education Resource Center (SERC) at Carleton College
Provider Set:
Teach the Earth
Author:
PRAJUKTI Bhattacharyya
Date Added:
11/15/2016
VEPP: Volcanic activity and monitoring of Pu`u `O`o, Kilauea volcano, Hawaii
Conditional Remix & Share Permitted
CC BY-NC-SA
Rating
0.0 stars

Brief three-line description of the activity or assignment and its strengths:

This is a 10-week group project for a Volcanic Hazards elective course, for undergraduate geology students. Students will access and analyze data from the current eruption of Pu`u `O`o, Kilauea volcano, Hawaii, and make interpretations of the activity. They will use data (mostly near-real-time) from a number of monitoring techniques, including seismic, deformation, observational, gas, and thermal. The activity will culminate with a written report and an oral presentation.

(Note: this resource was added to OER Commons as part of a batch upload of over 2,200 records. If you notice an issue with the quality of the metadata, please let us know by using the 'report' button and we will flag it for consideration.)

Subject:
Biology
Business and Communication
Communication
Life Science
Mathematics
Measurement and Data
Material Type:
Activity/Lab
Provider:
Science Education Resource Center (SERC) at Carleton College
Provider Set:
Teach the Earth
Author:
Lizzette Rodriguez
Date Added:
09/12/2020
VEPP: Volcano Monitoring and Interpretation of Real-Time Data: A Project for Non-Science Majors
Conditional Remix & Share Permitted
CC BY-NC-SA
Rating
0.0 stars

This is an exercise that is in development and has not yet been fully tested in the classroom. Please check back regularly for updates and changes.

An ongoing project for small class size comprised of non-science majors. Students use the VEPP website as a monitoring tool to document and interpret real-time volcanic deformation data at Pu'u 'O'o and determine whether an eruptive event is occurring. They also incorporate past events at Kilauea/Pu'u 'O'o as models.

Full length description:

This project should be started midway into the semester or quarter, continuing until the end of the semester (students must first have enough background in geology/volcanology before they can tackle this project successfully, so lectures on magmatic differentiation, types of volcanism- explosive vs effusive, and targeted activities need to precede the start of the project). Students need to know how to read the data on the VEPP website- if classroom wi-fi is available and most students have laptops, instruction on navigation and interpretation can take place in the classroom; if not, a computer lab may be required for at least one class session. However, a large part of familiarizing students with the website can also be accomplished lecture-style by the instructor logging on in a 'smart' classroom.

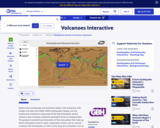
Students should be divided into three (or some suitable number of) groups: each group will be responsible for reporting weekly on a specific monitoring technique (tilt, seismic, GPS), retrieving and interpreting their information from VEPP/VALVE website. Additional information including updates, past information and geology may be obtained from the USGS Hawaiian Volcano Observatory website.

Students will report current deformation information each week in a "Monday morning meeting" format- each of the three groups will pass out a brief written summary on the data they are responsible for, and give an oral report with questions from the other two groups to follow each presentation. Team spokespersons will rotate every week. Each group will touch on potential sources of error associated with their particular monitoring technique, and attempt to differentiate between real information and what might be extraneous "noise". Groups should be given a short time to confer in class before they present, but prior outside group meetings will be essential to a successful weekly presentation.

At the end of the three group presentations, the instructor should moderate a general discussion by all in an attempt to have the groups integrate their data (i.e., does one data set support another? Is there disparity? What conclusions can be drawn from this particular week's information, and how does it seem to fit, both short-term and long-term?). Instructor may introduce other information sources, like live webcam photos and/or a discussion of past history, to offer support, or lack of support, for a specific interpretation of data being presented by a team or teams (HVO website is a great resource for this).

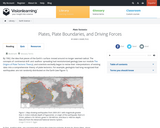
As the semester proceeds, each of the groups plot their data on a large graph situated in the front of the class. We'll use both graphical plots and location maps to pinpoint events if they occur. Lectures will incorporate other tools to hopefully enhance and lend credence to the interpretation process- use of geologic observations, gas emissions and other information, the main reference source being the HVO website. Past Kilauea/Pu'u 'O'o events will need to be examined for comparison purposes.

This exercise is meant to simulate some of the tasks that volcanologists undertake in the real world.

(Note: this resource was added to OER Commons as part of a batch upload of over 2,200 records. If you notice an issue with the quality of the metadata, please let us know by using the 'report' button and we will flag it for consideration.)

Subject:
Biology
Life Science
Physical Science
Physics
Material Type:
Activity/Lab
Provider:
Science Education Resource Center (SERC) at Carleton College
Provider Set:
Teach the Earth
Author:
Michael Johnson
Date Added:
11/15/2016
VEPP: Volcanologist Pro Tem: Exploring the Dynamics of Kilauea Volcano, Hawaii
Conditional Remix & Share Permitted
CC BY-NC-SA
Rating
0.0 stars

This is an exercise that is in development and has not yet been fully tested in the classroom. Please check back regularly for updates and changes.
This discovery activity puts students in the place of real volcanologists by giving them access to real-time data from Kilauea Volcano, Hawaii. They learn about volcano monitoring techniques, study case histories of important volcanic processes, and then form and test hypotheses for past and future volcanic events with multiple instruments and real-time data. As a result, students will understand the processes that shape a basaltic shield volcano.

(Note: this resource was added to OER Commons as part of a batch upload of over 2,200 records. If you notice an issue with the quality of the metadata, please let us know by using the 'report' button and we will flag it for consideration.)

Subject:
Biology
Life Science
Material Type:
Activity/Lab
Provider:
Science Education Resource Center (SERC) at Carleton College
Provider Set:
Teach the Earth
Author:
Eric Christiansen
Date Added:
09/12/2020
Vibrant Volcanoes
Read the Fine Print
Rating
0.0 stars

This lesson will introduce elementary students to the fiery and explosive nature of volcanoes, using segments from the NATURE film, “Kilauea: Mountain of Fire.” Students will get to know different features of volcanoes and volcanic activity: what volcanoes are like, where they are found, how and why they erupt, and what happens after an eruption.

Material Type:
Lesson Plan
Provider:
PBS
Provider Set:
NATURE
Date Added:
05/17/2009
Viewing geomorphic landforms with Google Earth
Conditional Remix & Share Permitted
CC BY-NC-SA
Rating
0.0 stars

For the assignment, the students are given a series of placemarks in Google Earth. Using Google Earth, the students 'fly' to various areas around the world. They examine the landforms at each placemark and answer questions regarding the formation of these features.
Designed for a geomorphology course
Uses online and/or real-time data
Has minimal/no quantitative component

(Note: this resource was added to OER Commons as part of a batch upload of over 2,200 records. If you notice an issue with the quality of the metadata, please let us know by using the 'report' button and we will flag it for consideration.)

Subject:
Applied Science
Biology
Environmental Science
Life Science
Material Type:
Activity/Lab
Provider:
Science Education Resource Center (SERC) at Carleton College
Provider Set:
Teach the Earth
Author:
Amy Brock
Date Added:
08/25/2019
Virtual Field Trip to Laki Fissure
Conditional Remix & Share Permitted
CC BY-NC-SA
Rating
0.0 stars

This is a virtual field trip to Iceland's Laki Fissure, which explores the 1783 eruption as a type example of a large historical lava flow eruption that had a significant impact on the local human population and the global environment. Students explore the climate impacts of the eruption, as well as the different types of volcanic deposits it produced. Students use their observations to develop hypotheses about past and future volcanic hazards associated with the volcano.

(Note: this resource was added to OER Commons as part of a batch upload of over 2,200 records. If you notice an issue with the quality of the metadata, please let us know by using the 'report' button and we will flag it for consideration.)

Subject:
Biology
Life Science
Material Type:
Simulation
Provider:
Science Education Resource Center (SERC) at Carleton College
Provider Set:
Teach the Earth
Author:
Katherine Kelley
Date Added:
08/15/2022
Virtual Field Trip to Mt. Vesuvius
Conditional Remix & Share Permitted
CC BY-NC-SA
Rating
0.0 stars

This is a virtual field trip to Italy's Mt. Vesuvius, which explores the 79AD eruption of the volcano. Students explore the excavated cities of Pompeii and Herculaneum, as well as the different types of volcanic deposits found to have buried those cities. Students use their observations to develop hypotheses about past and future volcanic hazards associated with the volcano.

(Note: this resource was added to OER Commons as part of a batch upload of over 2,200 records. If you notice an issue with the quality of the metadata, please let us know by using the 'report' button and we will flag it for consideration.)

Subject:
Biology
Life Science
Material Type:
Simulation
Provider:
Science Education Resource Center (SERC) at Carleton College
Provider Set:
Teach the Earth
Author:
Katherine Kelley
Date Added:
08/15/2022
Volcanic Ejecta from Sunset Crater
Conditional Remix & Share Permitted
CC BY-NC-SA
Rating
0.0 stars

Students are provided with equations and geological data to estimate the velocities and impact effects of volcanic bombs that were ejected during the last eruption of Sunset Crater, a young cinder cone volcano in northern Arizona.

Click here to view the full activity on the KÃyah Math Project website.

(Note: this resource was added to OER Commons as part of a batch upload of over 2,200 records. If you notice an issue with the quality of the metadata, please let us know by using the 'report' button and we will flag it for consideration.)

Subject:
Biology
Geoscience
Life Science
Mathematics
Measurement and Data
Physical Science
Statistics and Probability
Material Type:
Activity/Lab
Provider:
Science Education Resource Center (SERC) at Carleton College
Provider Set:
Teach the Earth
Author:
KÃyah Math Project development team: Nancy Zumoff, Christopher Schaufele, Steven Semken, Tracy Perkins, Lynn Onken, Philippe Laval, David Gonzales, and Andrew Becenti (deceased). KÃyah Math Project directed by Steven Semken , Arizona State University; and Christopher Schaufele and Nancy Zumoff, Professors of Mathematics, Emeritus. Archived at Arizona State University School of Earth and Space Exploration.
Date Added:
09/25/2022