Esta guía práctica acompaña la serie de videos Poder estadístico y tamaño …
Esta guía práctica acompaña la serie de videos Poder estadístico y tamaño de muestra en R, de mi canal de YouTube Investigación Abierta, que recomiendo ver antes de leer este documento. Contiene una explicación general del análisis de poder estadístico y cálculo de tamaño de muestra, centrándose en el procedimiento para realizar análisis de poder y tamaños de muestra en jamovi y particularmente en R, usando los paquetes pwr (para diseños sencillos) y Superpower (para diseños factoriales más complejos). La sección dedicada a pwr está ampliamente basada en este video de Daniel S. Quintana (2019).
Data Carpentry lesson from Ecology curriculum to learn how to analyse and …
Data Carpentry lesson from Ecology curriculum to learn how to analyse and visualise ecological data in R. Data Carpentry’s aim is to teach researchers basic concepts, skills, and tools for working with data so that they can get more done in less time, and with less pain. The lessons below were designed for those interested in working with ecology data in R. This is an introduction to R designed for participants with no programming experience. These lessons can be taught in a day (~ 6 hours). They start with some basic information about R syntax, the RStudio interface, and move through how to import CSV files, the structure of data frames, how to deal with factors, how to add/remove rows and columns, how to calculate summary statistics from a data frame, and a brief introduction to plotting. The last lesson demonstrates how to work with databases directly from R.
Data Carpentry's aim is to teach researchers basic concepts, skills, and tools …
Data Carpentry's aim is to teach researchers basic concepts, skills, and tools for working more effectively with data. The lessons below were designed for those interested in working with Genomics data in R.
The Biology Semester-long Course was developed and piloted at the University of …
The Biology Semester-long Course was developed and piloted at the University of Florida in Fall 2015. Course materials include readings, lectures, exercises, and assignments that expand on the material presented at workshops focusing on SQL and R.
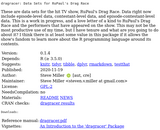
dragracer is an R package of data sets for all available seasons …
dragracer is an R package of data sets for all available seasons of RuPaul’s Drag Race, excluding All Stars. It’s updated at the end of each season. This blog post describes these data in some detail while also showcasing some of the things you can do with the provided. Steven Miller offers this R package for two reasons. First, the fandom for this show is large and there is a discernible subset of the fandom that is interested in the R programming language. He offers this package as a collection of accessible data with which they can experiment. He also offers this as a love letter of a kind to RuPaul’s Drag Race and all the contestants that have appeared on it.
This OER is an online tutorial for students learning the software R. …
This OER is an online tutorial for students learning the software R. The OER is anintroductory guide to exploratory data analysis in R. It is aimed primarily at graduate students in the biomedical sciences, but could be more broadly applicable.
The materials are an interactive tutorial that guides students through some basic analysis, asking them to input code to answer questions about conducting such analysis in R. Hints for the correct code are provided and a short quiz tests them on what they have learnt in the tutorial.
This guide is written using the ‘learnr’ package in the R software environment. The underlying R Markdown source code for this OER material is provided for download, with the intention that lecturers can modify it according to specific requirements. Students can use these materials as a standalone learning resource and use these materials for further learning.
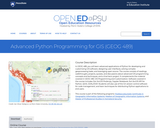
In GEOG 489, you will learn advanced applications of Python for developing …
In GEOG 489, you will learn advanced applications of Python for developing and customizing GIS software, designing user interfaces, solving complex geoprocessing tasks, and leveraging open source. The course consists of readings, walkthroughs, projects, quizzes, and discussions about advanced GIS programming concepts and techniques, and a final term project. It complements the material covered in GEOG 485: GIS Programming and Customization. Software covered in the course includes: Esri ArcGIS Pro/arcpy, Jupyter Notebook, Esri ArcGIS API for Python, QGIS, GDAL/OGR. Students will also use of the Git version control software for code management, and learn techniques for distributing Python applications to end users.
This book is about using the power of computers to do things …
This book is about using the power of computers to do things with geographic data. It teaches a range of spatial skills, including: reading, writing and manipulating geographic data; making static and interactive maps; applying geocomputation to solve real-world problems; and modeling geographic phenomena. By demonstrating how various geographic operations can be linked, in reproducible ‘code chunks’ that intersperse the prose, the book also teaches a transparent and thus scientific workflow. Learning how to use the wealth of geospatial tools available from the R command line can be exciting, but creating new ones can be truly liberating. Using the command-line driven approach taught throughout, and programming techniques covered in Chapter 11, can help remove constraints on your creativity imposed by software. After reading the book and completing the exercises, you should therefore feel empowered with a strong understanding of the possibilities opened up by R’s impressive geographic capabilities, new skills to solve real-world problems with geographic data, and the ability to communicate your work with maps and reproducible code.
These materials include background for the instructor and a lab that engages …
These materials include background for the instructor and a lab that engages student in an analysis of global inequality while learning and using the R language (a programming language for statistics). Students obtain data on the US and two other countries (one more developed and one less developed).
These materials include background for the instructor and a lab that engages …
These materials include background for the instructor and a lab that engages student in an analysis of global inequality while learning and using the R language (a programming language for statistics). Students ultimately write a function to access country level data from the CIA World Factbook.
Introductory statistics courses prepare students to think statistically but cover relatively few …
Introductory statistics courses prepare students to think statistically but cover relatively few statistical methods. Building on the basic statistical thinking emphasized in an introductory course, a second course in statistics at the undergraduate level can explore a large number of statistical methods. This text covers more advanced graphical summaries, One-Way ANOVA with pair-wise comparisons, Two-Way ANOVA, Chi-square testing, and simple and multiple linear regression models. Models with interactions are discussed in the Two-Way ANOVA and multiple linear regression setting with categorical explanatory variables. Randomization-based inferences are used to introduce new parametric distributions and to enhance understanding of what evidence against the null hypothesis “looks like”. Throughout, the use of the statistical software R via Rstudio is emphasized with all useful code and data sets provided within the text. This is Version 3.0 of the book.
Data Carpentry lesson to understand data structures and common storage and transfer …
Data Carpentry lesson to understand data structures and common storage and transfer formats for spatial data. The goal of this lesson is to provide an introduction to core geospatial data concepts. It is intended for learners who have no prior experience working with geospatial data, and as a pre-requisite for the R for Raster and Vector Data lesson . This lesson can be taught in approximately 75 minutes and covers the following topics: Introduction to raster and vector data format and attributes Examples of data types commonly stored in raster vs vector format Introduction to categorical vs continuous raster data and multi-layer rasters Introduction to the file types and R packages used in the remainder of this workshop Introduction to coordinate reference systems and the PROJ4 format Overview of commonly used programs and applications for working with geospatial data The Introduction to R for Geospatial Data lesson provides an introduction to the R programming language while the R for Raster and Vector Data lesson provides a more in-depth introduction to visualization (focusing on geospatial data), and working with data structures unique to geospatial data. The R for Raster and Vector Data lesson assumes that learners are already familiar with both geospatial data concepts and the core concepts of the R language.
Data Carpentry lesson to open, work with, and plot vector and raster-format …
Data Carpentry lesson to open, work with, and plot vector and raster-format spatial data in R. The episodes in this lesson cover how to open, work with, and plot vector and raster-format spatial data in R. Additional topics include working with spatial metadata (extent and coordinate reference systems), reprojecting spatial data, and working with raster time series data.
The goal of this lesson is to provide an introduction to R …
The goal of this lesson is to provide an introduction to R for learners working with geospatial data. It is intended as a pre-requisite for the R for Raster and Vector Data lesson for learners who have no prior experience using R. This lesson can be taught in approximately 4 hours and covers the following topics: Working with R in the RStudio GUI Project management and file organization Importing data into R Introduction to R’s core data types and data structures Manipulation of data frames (tabular data) in R Introduction to visualization Writing data to a file The the R for Raster and Vector Data lesson provides a more in-depth introduction to visualization (focusing on geospatial data), and working with data structures unique to geospatial data.
Welcome to R! Working with a programming language (especially if it’s your …
Welcome to R! Working with a programming language (especially if it’s your first time) often feels intimidating, but the rewards outweigh any frustrations. An important secret of coding is that even experienced programmers find it difficult and frustrating at times – so if even the best feel that way, why let intimidation stop you? Given time and practice* you will soon find it easier and easier to accomplish what you want. Why learn to code? Bioinformatics – like biology – is messy. Different organisms, different systems, different conditions, all behave differently. Experiments at the bench require a variety of approaches – from tested protocols to trial-and-error. Bioinformatics is also an experimental science, otherwise we could use the same software and same parameters for every genome assembly. Learning to code opens up the full possibilities of computing, especially given that most bioinformatics tools exist only at the command line. Think of it this way: if you could only do molecular biology using a kit, you could probably accomplish a fair amount. However, if you don’t understand the biochemistry of the kit, how would you troubleshoot? How would you do experiments for which there are no kits? R is one of the most widely-used and powerful programming languages in bioinformatics. R especially shines where a variety of statistical tools are required (e.g. RNA-Seq, population genomics, etc.) and in the generation of publication-quality graphs and figures. Rather than get into an R vs. Python debate (both are useful), keep in mind that many of the concepts you will learn apply to Python and other programming languages. Finally, we won’t lie; R is not the easiest-to-learn programming language ever created. So, don’t get discouraged! The truth is that even with the modest amount of R we will cover today, you can start using some sophisticated R software packages, and have a general sense of how to interpret an R script. Get through these lessons, and you are on your way to being an accomplished R user! * We very intentionally used the word practice. One of the other “secrets” of programming is that you can only learn so much by reading about it. Do the exercises in class, re-do them on your own, and then work on your own problems.
Today we are going to learn the basics of literate programming using …
Today we are going to learn the basics of literate programming using Jupyter Notebooks, a popular tool in data science, with the R kernel, so we can run R code in our notebooks. We’ll then take a look at how we use Git and GitHub to keep track of all the versions of our work, collaborate with others, and be open!
Hands-on experience designing, conducting, analyzing, and presenting experiments on the structure and …
Hands-on experience designing, conducting, analyzing, and presenting experiments on the structure and processing of human language. Focuses on constructing, conducting, analyzing, and presenting an original and independent experimental project of publishable quality. Develops skills in reading and writing scientific research reports in cognitive science, including evaluating the methods section of a published paper, reading and understanding graphical displays and statistical claims about data, and evaluating theoretical claims based on experimental data. Instruction and practice in oral and written communication provided.
The book is associated with the lsr package on CRAN and GitHub. …
The book is associated with the lsr package on CRAN and GitHub. The package is probably okay for many introductory teaching purposes, but some care is required. The package does have some limitations (e.g., the etaSquared function does strange things for unbalanced ANOVA designs), and it has not been updated in a while.
Open courseware for Macroevolution, focusing on research methods and software packages, such …
Open courseware for Macroevolution, focusing on research methods and software packages, such as R.
Course description Evolutionary thinking provides the underpinnings of modern biology. In recent decades, the field of macroevolution (evolution above the species level) has matured into a rich discipline with a well-developed mathematical theory for testing hypotheses of species diversification, for understanding trait evolution, and evaluating patterns of covariation across the tree of life. This course will provide a synthetic view of biology and how life on earth has changed over time.
Course Outcomes Upon completion of the course, students will: Understand patterns of diversity in the fossil record, and changes in that diversity over time Understand macroevolutionary patterns and processes, and the difference between gradualism, stasis, and punctuated equilibrium Become familiar with ‘tree thinking’, and understand the principles of using a phylogenetic perspective to address evolutionary questions in biology Gain experience in applying cutting-edge phylogenetic methods for testing hypotheses in macroevolution
No restrictions on your remixing, redistributing, or making derivative works. Give credit to the author, as required.
Your remixing, redistributing, or making derivatives works comes with some restrictions, including how it is shared.
Your redistributing comes with some restrictions. Do not remix or make derivative works.
Most restrictive license type. Prohibits most uses, sharing, and any changes.
Copyrighted materials, available under Fair Use and the TEACH Act for US-based educators, or other custom arrangements. Go to the resource provider to see their individual restrictions.