Updating search results...

Search Resources

104 Results

View
Selected filters:
  • natural-hazards
Earthquakes: Los Angeles
Read the Fine Print
Educational Use
Rating
0.0 stars

In this video segment adapted from NOVA, animations are used to show how the hills around Los Angeles were formed by earthquakes at small thrust faults that extend outward from the larger San Andreas fault.

Subject:
Astronomy
Chemistry
Education
Geology
Geoscience
Physical Science
Physics
Space Science
Material Type:
Activity/Lab
Diagram/Illustration
Provider:
PBS LearningMedia
Provider Set:
PBS Learning Media: Multimedia Resources for the Classroom and Professional Development
Author:
National Science Foundation
WGBH Educational Foundation
Date Added:
12/17/2005
Earthquakes: San Francisco
Read the Fine Print
Educational Use
Rating
0.0 stars

The history of earthquakes in the San Francisco Bay area is plotted on a digital map and analyzed in this video segment adapted from NOVA.

Subject:
Astronomy
Chemistry
Education
Geology
Geoscience
Physical Science
Physics
Space Science
Material Type:
Activity/Lab
Diagram/Illustration
Provider:
PBS LearningMedia
Provider Set:
PBS Learning Media: Multimedia Resources for the Classroom and Professional Development
Author:
National Science Foundation
WGBH Educational Foundation
Date Added:
12/17/2005
Earthquakes: The Prehistoric Record
Read the Fine Print
Educational Use
Rating
0.0 stars

In this video segment adapted from NOVA, a geologist digs a trench along the San Andreas Fault to reveal three thousand years of earthquake history. Information from the layers of sediment may help geologists to predict earthquakes.

Subject:
Applied Science
Astronomy
Chemistry
Education
Geology
Geoscience
Physical Science
Physics
Space Science
Technology
Material Type:
Activity/Lab
Diagram/Illustration
Provider:
PBS LearningMedia
Provider Set:
PBS Learning Media: Multimedia Resources for the Classroom and Professional Development
Author:
National Science Foundation
WGBH Educational Foundation
Date Added:
12/17/2005
Earthquakes: The Seismograph
Read the Fine Print
Educational Use
Rating
0.0 stars

This video segment adapted from NOVA uses historical illustrations, photographs, and animations to explain how seismographs work, the difference between P and S waves, and the Richter scale.

Subject:
Astronomy
Chemistry
Education
Geology
Geoscience
Physical Science
Physics
Space Science
Material Type:
Activity/Lab
Diagram/Illustration
Provider:
PBS LearningMedia
Provider Set:
PBS Learning Media: Multimedia Resources for the Classroom and Professional Development
Author:
National Science Foundation
WGBH Educational Foundation
Date Added:
12/17/2005
Engaging With Earthquake Hazard and Risk
Conditional Remix & Share Permitted
CC BY-NC-SA
Rating
0.0 stars

This introductory activity engages learners in the study of earthquake hazards and the risk these hazards pose to humans in the communities in which we live. Learners will compare three maps of Anchorage, AK, depicting spatial information related to seismic hazards to generate questions about the factors that influence shaking intensity and damage to the built environment during earthquakes.

(Note: this resource was added to OER Commons as part of a batch upload of over 2,200 records. If you notice an issue with the quality of the metadata, please let us know by using the 'report' button and we will flag it for consideration.)

Subject:
Biology
Life Science
Material Type:
Activity/Lab
Provider:
Science Education Resource Center (SERC) at Carleton College
Provider Set:
Teach the Earth
Author:
Jennifer Pickering
Date Added:
09/29/2022
Environmental Geology of the Area where you Live
Conditional Remix & Share Permitted
CC BY-NC-SA
Rating
0.0 stars

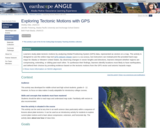
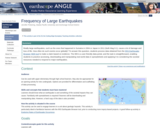
Students collect data for this term project starting with the first lab exercise and continuing throughout the semester. As each unit is covered in the text, class, and lab, students are directed to collect data relevant to their term project. For example: Topographic maps are covered at the start of the semester and students must locate their home; describe its location using the Public Land Survey, Universal Transverse Mercator, and Longitude-Latitude Systems; and describe the local topography. When natural hazards (flooding, slopes, earthquakes, volcanoes, and radon gas) are covered, students must use web resources (some of which are provided by the instructor at http://www2.ivcc.edu/phillips/geology/environmental_research.htm), local resources (such as the local fire chief, library, mayor, relatives, and neighbors), and personal observation to identify hazards and assess the risk they pose; these hazards are submitted as part of a lab assignment. The information collected is analyzed using the principles discussed in class and feedback is provided on pieces that are submitted throughout the semester. At the conclusion of the semester, students organize the collected information, add illustrations (maps and photos), analyze and evaluate the materials collected, and conclude the report with a discussion of how the area should be developed in the future based on the principles learned in the class.

The activity shows the students the immediate relevance of the material as it is covered, shows the students the types of information publicly available, and helps them develop critical analysis skills. The activity introducers students to basic geologic knowledge and shows them how to make use of it.

(Note: this resource was added to OER Commons as part of a batch upload of over 2,200 records. If you notice an issue with the quality of the metadata, please let us know by using the 'report' button and we will flag it for consideration.)

Subject:
Biology
Business and Communication
Hydrology
Life Science
Management
Physical Science
Political Science
Social Science
Material Type:
Lesson Plan
Provider:
Science Education Resource Center (SERC) at Carleton College
Provider Set:
Teach the Earth
Author:
Michael Phillips
Date Added:
11/30/2021
Episodic tremor and slip: The Case of the Mystery Earthquakes | Lessons on Plate Tectonics
Conditional Remix & Share Permitted
CC BY-NC-SA
Rating
0.0 stars

Earthquakes in western Washington and Oregon are to be expected -- the region lies in the Cascadia Subduction Zone. Offshore, the Juan de Fuca tectonic plate subducts under the North American plate, from northern California to British Columbia. The region, however, also experiences exotic seismicity -- Episodic Tremor and Slip (ETS).In this lesson, your students study seismic and GPS data from the region to recognize a pattern in which unusual tremors--with no surface earthquakes--coincide with jumps of GPS stations. This is ETS. Students model ductile and brittle behavior of the crust with lasagna noodles to understand how properties of materials depend on physical conditions. Finally, they assemble their knowledge of the data and models into an understanding of ETS in subduction zones and its relevance to the millions of residents in Cascadia.

(Note: this resource was added to OER Commons as part of a batch upload of over 2,200 records. If you notice an issue with the quality of the metadata, please let us know by using the 'report' button and we will flag it for consideration.)

Subject:
Biology
Life Science
Mathematics
Measurement and Data
Statistics and Probability
Material Type:
Activity/Lab
Provider:
Science Education Resource Center (SERC) at Carleton College
Provider Set:
Teach the Earth
Author:
Shelley Olds
Date Added:
08/27/2022
Evaluating Rainfall, Landslides, and Weather: Big Sur, California
Conditional Remix & Share Permitted
CC BY-NC-SA
Rating
0.0 stars

This activity leads to understanding common landslide hazards in the area and how they relate to weather patterns and/or local geology.

(Note: this resource was added to OER Commons as part of a batch upload of over 2,200 records. If you notice an issue with the quality of the metadata, please let us know by using the 'report' button and we will flag it for consideration.)

Subject:
Biology
Career and Technical Education
Environmental Studies
Geology
Life Science
Physical Science
Material Type:
Activity/Lab
Provider:
Science Education Resource Center (SERC) at Carleton College
Provider Set:
Teach the Earth
Author:
Ana Garcia-Garcia
Date Added:
12/31/2021
Evaluating natural hazards data to assess the risk to your California home
Conditional Remix & Share Permitted
CC BY-NC-SA
Rating
0.0 stars

Students use a series of maps and natural hazard data to evaluate the risk to a building structure of their choice in the state of California. For each hazard, students rate the potential risk in two dimensions: (1) Probability - probability that a hazardous event "may" occur, and (2) Severity of Impact - the size of the impact in terms of cost and impact on human health.

(Note: this resource was added to OER Commons as part of a batch upload of over 2,200 records. If you notice an issue with the quality of the metadata, please let us know by using the 'report' button and we will flag it for consideration.)

Subject:
Biology
Career and Technical Education
Environmental Studies
Geology
Life Science
Physical Science
Material Type:
Activity/Lab
Provider:
Science Education Resource Center (SERC) at Carleton College
Provider Set:
Teach the Earth
Author:
Corrie Neighbors
Date Added:
12/11/2021
Event Science: Kilauea Volcano
Conditional Remix & Share Permitted
CC BY-NC
Rating
0.0 stars

Public attention was captured in May 2018 when the Hawaiian volcano Kīlauea erupted with rivers of lava that flowed through Leilani Estates and other nearby neighborhoods. Your students may have seen videos of hot lava covering roads, destroying homes, or reaching the ocean with clouds of hot steam. You can capitalize on their interest by using data from this real-world event.

In these middle school lessons, students take on the role of volcanologists in order to analyze geologic data about the May 2018 eruption of Kīlauea and provide recommendations for mitigating its harmful effects.

Subject:
Biology
Geoscience
Life Science
Physical Science
Material Type:
Activity/Lab
Interactive
Lesson
Lesson Plan
Unit of Study
Provider:
Learning in Motion
Date Added:
08/28/2018
Exploring Tectonic Motions with GPS
Conditional Remix & Share Permitted
CC BY-NC-SA
Rating
0.0 stars

Using a map showing the horizontal velocities of GPS stations in the Plate Boundary Observatory and other GPS networks in Alaska and Western United States, students are able to describe the motions in different regions by interpreting the vectors resulting from long-term high-precision Global Positioning System (GPS) data.
Show more information on NGSS alignment
Hide
NGSS ALIGNMENT
Disciplinary Core Ideas
History of Earth: HS-ESS1-5
Earth' Systems: MS-ESS2-2
Earth and Human Activity: MS-ESS3-2, HS-ESS3-1
Science and Engineering Practices
4. Analyzing and Interpreting Data
5. Using Mathematics and Computational Thinking
6. Constructing Explanations and Designing Solutions
Crosscutting Concepts
4. Systems and System Models
7. Stability and Change

(Note: this resource was added to OER Commons as part of a batch upload of over 2,200 records. If you notice an issue with the quality of the metadata, please let us know by using the 'report' button and we will flag it for consideration.)

Subject:
Biology
Life Science
Mathematics
Measurement and Data
Statistics and Probability
Material Type:
Activity/Lab
Provider:
Science Education Resource Center (SERC) at Carleton College
Provider Set:
Teach the Earth
Author:
Shelley Olds
Date Added:
09/26/2022
Family Stress theories and risk communication to evaluate and build family resilience
Conditional Remix & Share Permitted
CC BY-NC-SA
Rating
0.0 stars

In this activity, students use theoretical knowledge about family stress theories to analyze family vignettes and make predictions about the level of risk or resilience each family might have should a natural disaster occur. To increase resilience, risk communication strategies are discussed.

(Note: this resource was added to OER Commons as part of a batch upload of over 2,200 records. If you notice an issue with the quality of the metadata, please let us know by using the 'report' button and we will flag it for consideration.)

Subject:
Biology
Life Science
Psychology
Social Science
Material Type:
Activity/Lab
Provider:
Science Education Resource Center (SERC) at Carleton College
Provider Set:
Teach the Earth
Author:
Tatjana Hocke-Mirzashvili
Date Added:
11/24/2018
Flooding in Virginia
Read the Fine Print
Rating
0.0 stars

In this activity, students use a National Weather Service flood forecast, USGS gauging data, and other reports to estimate the maximum storm discharge from the New River and Wolf Creek, two streams in the Southeast U.S. which experienced flooding in November 2003. Topographic and urban maps are used to predict where flooding would occur and to evaluate strategies for reducing flood risk for the residents of the region.

Subject:
Astronomy
Chemistry
Geoscience
Hydrology
Physical Science
Physics
Space Science
Material Type:
Activity/Lab
Interactive
Provider:
UCAR Staff
Provider Set:
New York State Earth Science Instructional Collection
Author:
Drew Patrick
Date Added:
11/06/2014
Forecasting Volcanic Eruptions
Read the Fine Print
Educational Use
Rating
0.0 stars

This media-rich essay from NOVA Online describes the challenges of forecasting volcanic eruptions and includes information about specific cases.

Subject:
Astronomy
Chemistry
Education
Geology
Geoscience
Physical Science
Physics
Space Science
Material Type:
Activity/Lab
Diagram/Illustration
Interactive
Provider:
PBS LearningMedia
Provider Set:
PBS Learning Media: Multimedia Resources for the Classroom and Professional Development
Author:
National Science Foundation
WGBH Educational Foundation
Date Added:
12/17/2005
Frequency of Large Earthquakes
Conditional Remix & Share Permitted
CC BY-NC-SA
Rating
0.0 stars

Using the IRIS Earthquake Browser tool, students gather data to support a claim about how many large (Mw 8+) earthquakes will happen globally each year. This activity provides scaffolded experience downloading data and manipulating data within a spreadsheet.

(Note: this resource was added to OER Commons as part of a batch upload of over 2,200 records. If you notice an issue with the quality of the metadata, please let us know by using the 'report' button and we will flag it for consideration.)

Subject:
Biology
Life Science
Mathematics
Measurement and Data
Statistics and Probability
Material Type:
Activity/Lab
Provider:
Science Education Resource Center (SERC) at Carleton College
Provider Set:
Teach the Earth
Author:
Jennifer Pickering
Date Added:
09/13/2022
Geographic Perspectives on Sustainability and Human-Environment Systems
Conditional Remix & Share Permitted
CC BY-NC-SA
Rating
0.0 stars

What factors lead to a natural disaster? What causes a famine? Why do cities flood? According to a recent article in The Atlantic, Houston's flooding during the 2017 Hurricane Harvey was primarily caused by impervious pavement which prevents the absorption of water into the land. This example illustrates how nature and society are interlinked, which is the main focus of Geography 30, Penn State's introductory course to nature-society geography. In addition to examining the linkages between human development and natural hazards, this course will also explore human society's connection to food systems, climate change, urbanization and biodiversity. The course will also cover topics of ethics and decision making in order to help students evaluate the tradeoffs of these interconnections.
\The Atlantic\" needs to be made into a link pointing to this: https://www.theatlantic.com/technology/archive/2017/08/why-cities-flood/538251/"

Subject:
Applied Science
Career and Technical Education
Cultural Geography
Ecology
Environmental Science
Environmental Studies
Geology
Life Science
Physical Science
Social Science
Material Type:
Full Course
Provider:
Penn State College of Earth and Mineral Sciences
Author:
Brian King
Chongming Wang
Karl Zimmerer
Petra Tschakert
Date Added:
10/07/2019
Geologic Hazards and the Built Environment
Conditional Remix & Share Permitted
CC BY-NC-SA
Rating
0.0 stars

Collaborative, research-based activity of varying lengths. Main outcome is to identify potential vulnerabilities in the built environment and possible solutions.

(Note: this resource was added to OER Commons as part of a batch upload of over 2,200 records. If you notice an issue with the quality of the metadata, please let us know by using the 'report' button and we will flag it for consideration.)

Subject:
Biology
Life Science
Material Type:
Activity/Lab
Provider:
Science Education Resource Center (SERC) at Carleton College
Provider Set:
Teach the Earth
Author:
Jennifer Pickering
Date Added:
09/13/2022
Geology of the National Parks
Conditional Remix & Share Permitted
CC BY-NC-SA
Rating
0.0 stars

Geysers and grizzlies and glaciers, oh my. The national parks may be America's best idea, saving the finest parts of the nation for everyone to enjoy forever. What better way to learn about the natural world than to tour the parks with us? We'll explore how the mountains and valleys formed and why they often come with volcanoes and earthquakes. You'll see what really killed the dinosaurs and how we can help save their modern relatives in the parks. With film clips, slide shows, and our geological interpretations of classic rock songs, isn't it time for a road trip?

Subject:
Applied Science
Biology
Ecology
Environmental Science
Geology
Life Science
Physical Science
Material Type:
Full Course
Provider:
Penn State College of Earth and Mineral Sciences
Author:
Richard Alley
Sridhar Anandakrishnan
Date Added:
10/07/2019
Getting students started with the Quake Catcher Network
Conditional Remix & Share Permitted
CC BY-NC-SA
Rating
0.0 stars

Teacher guide and tutorial for accessing data using the Quake Catcher Network (QCN) portal.

(Note: this resource was added to OER Commons as part of a batch upload of over 2,200 records. If you notice an issue with the quality of the metadata, please let us know by using the 'report' button and we will flag it for consideration.)

Subject:
Biology
Life Science
Material Type:
Activity/Lab
Provider:
Science Education Resource Center (SERC) at Carleton College
Provider Set:
Teach the Earth
Author:
Jennifer Pickering
Date Added:
09/10/2022
The Great Flood of 1993
Read the Fine Print
Educational Use
Rating
0.0 stars

In this video segment adapted from NOVA, a meteorologist explains how an unusual weather pattern led to one of the most devastating floods of this century.

Subject:
Hydrology
Physical Science
Material Type:
Activity/Lab
Diagram/Illustration
Provider:
PBS LearningMedia
Provider Set:
PBS Learning Media: Multimedia Resources for the Classroom and Professional Development
Author:
National Science Foundation
WGBH Educational Foundation
Date Added:
12/17/2005