Students run a pump test and interpret the results as drawdown curves …
Students run a pump test and interpret the results as drawdown curves and hydraulic conductivity measurements.
(Note: this resource was added to OER Commons as part of a batch upload of over 2,200 records. If you notice an issue with the quality of the metadata, please let us know by using the 'report' button and we will flag it for consideration.)
In week one of the exercise students determine stream discharge by doing …
In week one of the exercise students determine stream discharge by doing some tedious, but simple hand calculations using data sets provided by the instructor. The following week is designed to be more hands-on. Here, they collect their own field data and create a spreadsheet to perform the calculations more efficiently and accurately. By collecting the data themselves, students gain a more thorough understanding of how stream discharge is both measured and computed; they also learn how the results can be used to determine groundwater baseflow. The fact they do hand calculations prior to creating the spreadsheet helps build their math skills and reduces the "black-box" effect that often develops when using software for data analysis. Students also gain valuable experience creating spreadsheets and learn how this tool can be used to perform repetitive computations more efficiently and with less error. Finally, this exercise asks students to consider the accuracy of their replicate field measurements through a series of questions related to their standard deviation and percent error calculations.
(Note: this resource was added to OER Commons as part of a batch upload of over 2,200 records. If you notice an issue with the quality of the metadata, please let us know by using the 'report' button and we will flag it for consideration.)
We know that glacial cycles produce changes in stream regimens downstream from …
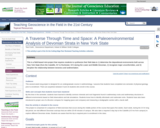
We know that glacial cycles produce changes in stream regimens downstream from the active ice margin, and that successive glacial cycles often result in separate (and usually lower) floodplains that become terraces following each cycle of stream incision. Using a suite of 4-5 glacio-fluvial terraces outside the mouth of Little PopoAgie Canyon on the east flank of Wyoming's Wind River Range, students do the following: (1) produce a map of the major terrace landforms, (2) observe the geomorphic characteristics of each map unit (this includes height above present stream, depth of fine overbank material above coarse bedload, and general weathering characteristics of the units, and whether the unit is a cut or fill terrace), and (3) measure the characteristics of soil profiles dug into each unit (including horizons Id's, depth and thickness of horizons, and carbonate morphology). Students use all this information to place the terrace units into the regional glacio-fluvial chronology by matching the relative age-data with the Pinedale/Bull Lake/Pre-Bull Lake regional sequence. Final project must include a graphic representation of stream heights that fit their interpretations of the regional glacio-fluvial stratigraphy.
(Note: this resource was added to OER Commons as part of a batch upload of over 2,200 records. If you notice an issue with the quality of the metadata, please let us know by using the 'report' button and we will flag it for consideration.)
In this field exercise for an introductory environmental science course, students investigate …
In this field exercise for an introductory environmental science course, students investigate plant cover and type in a riparian area using transects. The final assignment is a lab report that includes a summary data table, a graph of cover types along their transect and an analysis of riparian health.
(Note: this resource was added to OER Commons as part of a batch upload of over 2,200 records. If you notice an issue with the quality of the metadata, please let us know by using the 'report' button and we will flag it for consideration.)
In this lab, students compare fresh rocks with their weathered equivalents. (Note: …
In this lab, students compare fresh rocks with their weathered equivalents.
(Note: this resource was added to OER Commons as part of a batch upload of over 2,200 records. If you notice an issue with the quality of the metadata, please let us know by using the 'report' button and we will flag it for consideration.)
This is a Stratigraphy Sedimentary Petrology field trip stop at an exceptional …
This is a Stratigraphy Sedimentary Petrology field trip stop at an exceptional glacial outwash gravel quarry, where students measure, identify and count clast types, measure cross-bedding directions, and examine the early stages of lithification of gravel to conglomerate. The gravel deposits are also representative of the local surficial aquifer material that lies nearby in the subsurface.
(Note: this resource was added to OER Commons as part of a batch upload of over 2,200 records. If you notice an issue with the quality of the metadata, please let us know by using the 'report' button and we will flag it for consideration.)
The student understands that snow leads to avalanches, but is often very …
The student understands that snow leads to avalanches, but is often very inexperienced in the observation of the snow pack. This exercise provides the opportunity to learn about snow stratigraphy, observation, and measurement from a detailed observational perspective. The students work in small groups in 3-6 pits (depends on the class size). By working on a transect from the trees out into the opening, they discover (usually) that the snow depth is different and that the descriptions in the pits differ as one proceeds out from the trees into the opening. (Different stratigraphic units, different thickness, different temperature, different density, different crystals.)
(Note: this resource was added to OER Commons as part of a batch upload of over 2,200 records. If you notice an issue with the quality of the metadata, please let us know by using the 'report' button and we will flag it for consideration.)
describing soils in natural exposures (Note: this resource was added to OER …
describing soils in natural exposures
(Note: this resource was added to OER Commons as part of a batch upload of over 2,200 records. If you notice an issue with the quality of the metadata, please let us know by using the 'report' button and we will flag it for consideration.)
GIS program allows computation and display of three point problem and contact …
GIS program allows computation and display of three point problem and contact tracing across topopgraphy. It helps students visualize how terrain and stratigraphy interact.
(Note: this resource was added to OER Commons as part of a batch upload of over 2,200 records. If you notice an issue with the quality of the metadata, please let us know by using the 'report' button and we will flag it for consideration.)
Teachers are immersed in an intense, graduate-level study of Minnesota geology using …
Teachers are immersed in an intense, graduate-level study of Minnesota geology using a model of inquiry-based field studies to deepen their understanding of the principles of geoscience and to develop field investigations that will enable their students to understand the way the Earth and Science work.
(Note: this resource was added to OER Commons as part of a batch upload of over 2,200 records. If you notice an issue with the quality of the metadata, please let us know by using the 'report' button and we will flag it for consideration.)
The purpose of this project is to develop students' field skills by …
The purpose of this project is to develop students' field skills by starting at the outcrop scale and then building on these experiences to create a regional picture of events by visiting multiple sites across NY. Students become proficient and efficient at measuring stratigraphic sections in teams after 5 weeks of field work. We visit eight outcrops within 5 weeks and measure detailed stratigraphic sections at each site. We begin by learning how to measure a detailed ~6 m thick stratigraphic section of siliciclastic rocks exposed in a local state park (that students visited during their introductory physical geology course) using a Jacob staff and Brunton. The outcrop is comprised of only 3 lithologies, but many sedimentary structures (bioturbation, flute casts, drag marks, groove casts, asymmetric ripples (plan view) and trough cross-beds). These lithofacies repeat several times even within the ~6 m measured section as these are turbidite deposits. We return to the lab after measuring the section and students work up their field data to construct a detailed, hand-drawn stratigraphic section for the first time. Students also make paleocurrent measurements in the field when possible and learn to plot these pooled class data during the next class meeting. For the other local sections, students perform the same field observations and measurements. At these locales, several formations crop out and students learn to recognize them based on their lithologic and paleontologic composition. Both carbonate and siliciclastic rocks occur at these sites. During the 3-day weekend field trip, students measure three stratigraphic sections of Lower Devonian through Middle Devonian strata and recognize that, for example, western NY lacks the Helderberg carbonate sequence and that the Oriskany Sandstone is thicker and laterally continuous in eastern NY rather than the lenses that crop out in central-western NY. Students also realize that the Hamilton Group changes character as they march across NY, building on their reading of Walther's Law in Boggs (2006) and their in-class stratigraphic correlation (lithostratigraphy, biostratigraphy) exercises from Fichter and Poche (2001) completed prior to the weekend field trip.
(Note: this resource was added to OER Commons as part of a batch upload of over 2,200 records. If you notice an issue with the quality of the metadata, please let us know by using the 'report' button and we will flag it for consideration.)
The constellations of satellites orbiting our planet enable high-precision positioning not just …
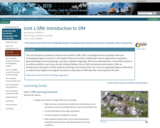
The constellations of satellites orbiting our planet enable high-precision positioning not just for consumer or survey applications but also for geoscience research such as detecting plate motions, landslide movement, or other changes on the Earth's surface. This unit introduces students to the fundamentals of these global navigation satellite systems (GNSS), the reference frames used for positioning, and the different acquisition techniques, including their merits and accuracy. Through classroom and field activities, students develop a familiarity with the variety of instrumentation and applications available with GNSS. This unit provides a broad conceptual understanding of GNSS applicable to all acquisition techniques. Subsequent units focus on kinematic and static methods and the different products generated using those GNSS methods.
Show more information on GPS versus GNSS Hide Note: Although the term GPS (Global Positioning System) is more commonly used in everyday language, it officially refers only to the USA's constellation of satellites. GNSS (Global Navigation Satellite System) is a universal term that refers to all satellite navigation systems including those from the USA (GPS), Russia (GLONASS), European Union (Galileo), China (BeiDou), and others. In this module, we use the term GNSS to refer generically to the use of one or more satellite constellations to determine position.
(Note: this resource was added to OER Commons as part of a batch upload of over 2,200 records. If you notice an issue with the quality of the metadata, please let us know by using the 'report' button and we will flag it for consideration.)
This unit introduces students to Structure from Motion (SfM). SfM is a …
This unit introduces students to Structure from Motion (SfM). SfM is a photogrammetric technique that uses overlapping images to construct a 3D model of the scene and has widespread research applications in geodesy, geomorphology, structural geology, and other subfields of geology. SfM can be collected from a hand-held camera or an airborne platform such as an aircraft, tethered balloon, kite, or UAS (unmanned aerial system). After an introduction to the basics of SfM, students will design and conduct their own survey of a geologic feature, followed by an optional (but highly encouraged) introductory exploration of SfM data after returning from the field.
Show more about Online Teaching suggestions Hide Online teaching: This unit was adapted to an online remote field teaching activity. Getting started with Structure from Motion (SfM) photogrammetry (remote field collection).
(Note: this resource was added to OER Commons as part of a batch upload of over 2,200 records. If you notice an issue with the quality of the metadata, please let us know by using the 'report' button and we will flag it for consideration.)
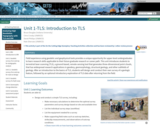
Field experience using geodetic and geophysical tools provides a unique opportunity for …
Field experience using geodetic and geophysical tools provides a unique opportunity for upper-level undergraduates to learn research skills applicable to their future graduate research or career path. This unit introduces students to terrestrial laser scanning (TLS), a ground-based, remote-sensing tool that generates three-dimensional point clouds, that has widespread research applications in geodesy, geomorphology, structural geology, and other subfields of geology. After an introduction to the basics of TLS, students will design and conduct their own survey of a geologic feature, followed by an optional introductory exploration of TLS data after returning from the field.
(Note: this resource was added to OER Commons as part of a batch upload of over 2,200 records. If you notice an issue with the quality of the metadata, please let us know by using the 'report' button and we will flag it for consideration.)
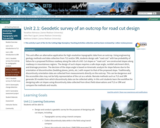
This unit offers an alternative application for high-resolution topographic data from an …
This unit offers an alternative application for high-resolution topographic data from an outcrop. Using engineering geology methods and data collection from TLS and/or SfM, students design safe "road cuts" with low probability of failure for a proposed fictitious roadway along the side of a hill. Cut slopes or "road cuts" are constructed slopes along roadways in mountainous regions. The design of such slopes requires a safe slope angle, rockfall catchment ditch, and drainage provision. The decision of the slope angle is based on kinematic analysis for slope failures due to the orientation of discontinuities (bedding planes, joints, etc.) with respect to that of the proposed slope. Traditionally, discontinuity orientation data are collected from measurements directly on the outcrop. This can be dangerous and the accessible sites may not be fully representative of the cut as a whole. Remote methods such as TLS and SfM generate 3D models from which discontinuity data can be collected safely. In this unit students learn the workflow for designing safe cut slopes using discontinuity data collected from direct field observations and TLS or SfM and compare the methods and results.
(Note: this resource was added to OER Commons as part of a batch upload of over 2,200 records. If you notice an issue with the quality of the metadata, please let us know by using the 'report' button and we will flag it for consideration.)
Kinematic GNSS surveys can provide a rapid means of collecting widely distributed, …
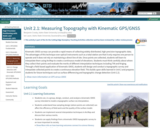
Kinematic GNSS surveys can provide a rapid means of collecting widely distributed, high-precision topographic data. The advantages of this technique over optical instruments such as a total station are that it only requires one person to operate and it does not rely on maintaining a direct line of site. Once points are collected, students will learn to interpolate them using ArcMap to create a continuous model of elevations. Students must think carefully about where they collect their points and evaluate the merits of different interpolation techniques including TIN and Kriging. Through a field-based application of kinematic GNSS, students will design and conduct a topographic survey and interpolate collected points to create a continuous elevation field. This builds upon skills learned in Unit 2 and prepares students for future techniques such as surface differencing and topographic change detection (Unit 2.2).
Show more information on GPS versus GNSS Hide Note: Although the term GPS (Global Positioning System) is more commonly used in everyday language, it officially refers only to the USA's constellation of satellites. GNSS (Global Navigation Satellite System) is a universal term that refers to all satellite navigation systems including those from the USA (GPS), Russia (GLONASS), European Union (Galileo), China (BeiDou), and others. In this module, we use the term GNSS to refer generically to the use of one or more satellite constellations to determine position.
(Note: this resource was added to OER Commons as part of a batch upload of over 2,200 records. If you notice an issue with the quality of the metadata, please let us know by using the 'report' button and we will flag it for consideration.)
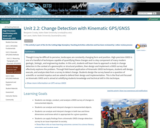
Though it may be difficult to perceive, landscapes are constantly changing form …
Though it may be difficult to perceive, landscapes are constantly changing form and position. High-precision GNSS is one of a handful of techniques capable of quantifying these changes and is a key component of many modern geologic, biologic, and engineering studies. In this unit, students will learn how to approach a study in change detection in the context of a geomorphic or structural problem, then design and implement a GNSS survey that effectively explores the problem. Through field-based application of kinematic GNSS techniques, students will design, execute, and analyze data from a survey to detect change. Students design the survey based on a question of scientific or societal impetus and are asked to defend their design and implementation. This is the final unit focused on kinematic GNSS and is aimed at solidifying students knowledge and technical skill in this technique.
Show more information on GPS versus GNSS Hide Note: Although the term GPS (Global Positioning System) is more commonly used in everyday language, it officially refers only to the USA's constellation of satellites. GNSS (Global Navigation Satellite System) is a universal term that refers to all satellite navigation systems including those from the USA (GPS), Russia (GLONASS), European Union (Galileo), China (BeiDou), and others. In this module, we use the term GNSS to refer generically to the use of one or more satellite constellations to determine position.
(Note: this resource was added to OER Commons as part of a batch upload of over 2,200 records. If you notice an issue with the quality of the metadata, please let us know by using the 'report' button and we will flag it for consideration.)
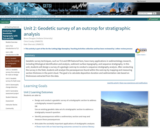
Geodetic survey techniques, such as TLS and SfM featured here, have many …
Geodetic survey techniques, such as TLS and SfM featured here, have many applications in sedimentology research, including lithological identification and analysis, sediment surface topography, and sequence stratigraphy. In this unit, students will design a survey of a geologic outcrop to conduct a sequence stratigraphy analysis. After conducting the survey in the field, students will analyze the parasequences found within the outcrop by mapping and measuring section thickness in the point cloud. The goal is to calculate deposition duration and sedimentation rate based on thicknesses extracted from the data.
(Note: this resource was added to OER Commons as part of a batch upload of over 2,200 records. If you notice an issue with the quality of the metadata, please let us know by using the 'report' button and we will flag it for consideration.)
The application of Global Navigation Satellite Systems (GNSS) in the earth sciences …
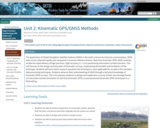
The application of Global Navigation Satellite Systems (GNSS) in the earth sciences has become commonplace. GNSS data can be collected rapidly and compared in common reference frames. Real-time kinematic (RTK) GNSS methods enable the rapid delivery of high-precision, high-accuracy (+/- 2 cm) positioning information to field scientists. This unit focuses on the design and execution of kinematic surveys, emphasizing the benefits and limitations of the technique. Students will learn which research questions the technique is most applicable for, as well as the standard data processing techniques. Students advance their understanding of GNSS through a technical knowledge of kinematic GNSS surveys. This unit prepares students to design and implement a survey of their own through hands-on instruction and demonstration of real-time kinematic (RTK) or post-processed kinematic (PPK) techniques in a field setting.
Show more information on GPS versus GNSS Hide Note: Although the term GPS (Global Positioning System) is more commonly used in everyday language, it officially refers only to the USA's constellation of satellites. GNSS (Global Navigation Satellite System) is a universal term that refers to all satellite navigation systems including those from the USA (GPS), Russia (GLONASS), European Union (Galileo), China (BeiDou), and others. In this module, we use the term GNSS to refer generically to the use of one or more satellite constellations to determine position.
(Note: this resource was added to OER Commons as part of a batch upload of over 2,200 records. If you notice an issue with the quality of the metadata, please let us know by using the 'report' button and we will flag it for consideration.)
In this unit, students will design a survey (TLS and/or SfM) of …
In this unit, students will design a survey (TLS and/or SfM) of a fault scarp. After conducting the survey in the field, students will analyze the data to identify the number and magnitude of possible fault displacement(s) by measuring offsets in the point cloud as well as calculate the recurrence interval of the fault based on either a known age or scarp morphometric age (or both). The goal is to create a brief report summarizing the methods used and Quaternary history of displacements on the fault. An optional extension exercise (Unit 3.5) has the students conduct a hillslope diffusion analysis is using MATLAB. Fault scarps are the topographic evidence of earthquakes large and shallow enough to break the ground surface, and are evidence of Quaternary fault activity. A primary goal of studying exposed scarps is to gain insight into the magnitude and frequency of fault slip. Scarps typically begin as step-shaped landforms and deteriorate with age through erosion. In some cases, the form of the scarp may record evidence of more than one earthquake, distinguished by a change in scarp slope. Assuming the same surface processes, the relative age of fault scarps can be determined by their morphology (shape).
(Note: this resource was added to OER Commons as part of a batch upload of over 2,200 records. If you notice an issue with the quality of the metadata, please let us know by using the 'report' button and we will flag it for consideration.)
Bruce Douglas (Indiana University)
Nicholas Pinter (University of California Davis)
Nathan Niemi (University of Michigan)
J. Ramon Arrowsmith (Arizona State University)
Kate Shervais (UNAVCO)
Chris Crosby (UNAVCO)
No restrictions on your remixing, redistributing, or making derivative works. Give credit to the author, as required.
Your remixing, redistributing, or making derivatives works comes with some restrictions, including how it is shared.
Your redistributing comes with some restrictions. Do not remix or make derivative works.
Most restrictive license type. Prohibits most uses, sharing, and any changes.
Copyrighted materials, available under Fair Use and the TEACH Act for US-based educators, or other custom arrangements. Go to the resource provider to see their individual restrictions.