In this short video from ClimateCentral, host Jessica Harrop explains what evidence …
In this short video from ClimateCentral, host Jessica Harrop explains what evidence scientists have for claiming that recent global warming is caused by humans and is not just part of a natural cycle.
This lab exercise is designed to provide a basic understanding of a …
This lab exercise is designed to provide a basic understanding of a real-world scientific investigation. Learners are introduced to the concept of tropospheric ozone as an air pollutant due to human activities and burning of fossil fuels. Students analyze and visualize data to investigate this air pollution and climate change problem, determine the season in which it commonly occurs, and communicate the results.
Here students use data from the NOAA carbon dioxide monitoring sites, such …
Here students use data from the NOAA carbon dioxide monitoring sites, such as Mauna Loa, to graph the Keeling Curve for themselves on large sheets of paper. Each group graphs one year, and the graphs are joined at the end to reveal the overall upward trend. The explanation describes the carbon cycle and how human activities are leading to the overall trend of rising carbon dioxide.
Students work as a team to determine the causes, effects, and solutions …
Students work as a team to determine the causes, effects, and solutions to ozone depletion. They work out what they need to know, and split the team up to research different parts of the issue.
(Note: this resource was added to OER Commons as part of a batch upload of over 2,200 records. If you notice an issue with the quality of the metadata, please let us know by using the 'report' button and we will flag it for consideration.)
This site has a collection of role-playing exercises that provide the students …
This site has a collection of role-playing exercises that provide the students with equations and data to use in collaborative problem-solving.
(Note: this resource was added to OER Commons as part of a batch upload of over 2,200 records. If you notice an issue with the quality of the metadata, please let us know by using the 'report' button and we will flag it for consideration.)
This video is the second of a three-video series in the Sea …
This video is the second of a three-video series in the Sea Change project, which follows the work of Dr. Maureen Raymo, paleogeologist at Columbia University's Lamont-Doherty Earth Observatory, who travels with fellow researchers to Australia in search of evidence of sea level that was once higher than it is today.
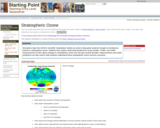
In this hands-on activity, participants learn the characteristics of the five layers …
In this hands-on activity, participants learn the characteristics of the five layers of the atmosphere and make illustrations to represent them. They roll the drawings and place them in clear plastic cylinders, and then stack the cylinders to make a model column of the atmosphere.
Students explore observational data from ozone-sondes, TOMS, and UARS measurements to learn …
Students explore observational data from ozone-sondes, TOMS, and UARS measurements to learn about changes in stratospheric ozone over the past several decades.
(Note: this resource was added to OER Commons as part of a batch upload of over 2,200 records. If you notice an issue with the quality of the metadata, please let us know by using the 'report' button and we will flag it for consideration.)
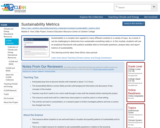
Sustainability is a complex term applied to many different contexts in a …
Sustainability is a complex term applied to many different contexts in a variety of ways. As a result, it can be challenging to determine how sustainable something really is. In this module, students will use an analytical framework with publicly available data to formulate questions, analyze data, and report metrics of sustainability.
Students use real satellite data to determine 1) where the greatest concentrations …
Students use real satellite data to determine 1) where the greatest concentrations of aerosols are located during the course of a year in the tropical Atlantic region and 2) their source of origin. This is an inquiry-style lesson where students pull real aerosol data and attempt to identify trends among data sets.
This is a jigsaw activity in which students are assigned to research …
This is a jigsaw activity in which students are assigned to research one step out of five in the geochemical process stages of the organic carbon cycle. Students then teach their step in cross-step groups until everyone understands all five process stages.
In this Earth Exploration Toolbook chapter, students select, explore, and analyze satellite …
In this Earth Exploration Toolbook chapter, students select, explore, and analyze satellite imagery. They do so in the context of a case study of the origins of atmospheric carbon monoxide and aerosols, tiny solid airborne particles such as smoke from forest fires and dust from desert wind storms. They use the software tool ImageJ to animate a year of monthly images of aerosol data and then compare the animation to one created for monthly images of carbon monoxide data. Students select, explore, and analyze satellite imagery using NASA Earth Observatory (NEO) satellite data and NEO Image Composite Explorer (ICE) tool to investigate seasonal and geographic patterns and variations in concentration of CO and aerosols in the atmosphere.
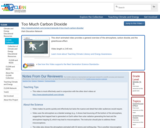
Students explore the increase in atmospheric carbon dioxide over the past 40 …
Students explore the increase in atmospheric carbon dioxide over the past 40 years with an interactive online model. They use the model and observations to estimate present emission rates and emission growth rates. The model is then used to estimate future levels of carbon dioxide using different future emission scenarios. These different scenarios are then linked by students to climate model predictions also used by the Intergovernmental Panel on Climate Change.
This is a teaching activity in which students learn about the connection …
This is a teaching activity in which students learn about the connection between CO2 emissions, CO2 concentration, and average global temperatures. Through a simple online model, students learn about the relationship between these and learn about climate modeling while predicting temperature change over the 21st century.
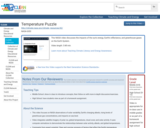
Children discover the relationship between temperature and pressure in the lower atmospheres …
Children discover the relationship between temperature and pressure in the lower atmospheres of Jupiter and Earth. They chart the increasing temperature as they add pressure to a 2-liter soda bottle with a Fizz-Keeper Pump.
This video provides history on product development by General Motors and other …
This video provides history on product development by General Motors and other industries that led to the release of Chlorofluorocarbons (CFCs). It explains the connection between global warming and the ozone hole, chemical build-up in our lower and upper atmospheres, the increase in GWP gases, increased air quality ozone alerts and the 1987 Montreal Protocol that banned the use of CFCs globally.
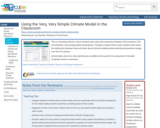
In this interactive activity students will create a very simple climate model. …
In this interactive activity students will create a very simple climate model. They use worksheets, chips/tokens, and follow rules for heat exchange. The activity only models temperature but there are instructions for adaptations of the model, such as rule changes for an atmosphere with increased levels of CO2.
No restrictions on your remixing, redistributing, or making derivative works. Give credit to the author, as required.
Your remixing, redistributing, or making derivatives works comes with some restrictions, including how it is shared.
Your redistributing comes with some restrictions. Do not remix or make derivative works.
Most restrictive license type. Prohibits most uses, sharing, and any changes.
Copyrighted materials, available under Fair Use and the TEACH Act for US-based educators, or other custom arrangements. Go to the resource provider to see their individual restrictions.