A board game which engages students as they grapple with the complexities …
A board game which engages students as they grapple with the complexities of society's challenges. It encourages students to cultivate a deep and layered understanding of these challenges and current societal options for producing energy.
This course introduces the parallel evolution of life and the environment. Life …
This course introduces the parallel evolution of life and the environment. Life processes are influenced by chemical and physical processes in the atmosphere, hydrosphere, cryosphere and the solid earth. In turn, life can influence chemical and physical processes on our planet. This course explores the concept of life as a geological agent and examines the interaction between biology and the earth system during the roughly 4 billion years since life first appeared.
The Keystone Pipeline is a complex project that raises important environmental, economic, …
The Keystone Pipeline is a complex project that raises important environmental, economic, and international policy issues. Tar sands from Alberta Canada will be mined and processed and transported on a ~1700 mile pipeline to refineries in the United States. How should decisions be made responsibly and ethically to balance societal energy needs with anticipated environmental impacts related to mining and processing the tar sands and the ultimate impacts on climate change.
(Note: this resource was added to OER Commons as part of a batch upload of over 2,200 records. If you notice an issue with the quality of the metadata, please let us know by using the 'report' button and we will flag it for consideration.)
What factors lead to a natural disaster? What causes a famine? Why …
What factors lead to a natural disaster? What causes a famine? Why do cities flood? According to a recent article in The Atlantic, Houston's flooding during the 2017 Hurricane Harvey was primarily caused by impervious pavement which prevents the absorption of water into the land. This example illustrates how nature and society are interlinked, which is the main focus of Geography 30, Penn State's introductory course to nature-society geography. In addition to examining the linkages between human development and natural hazards, this course will also explore human society's connection to food systems, climate change, urbanization and biodiversity. The course will also cover topics of ethics and decision making in order to help students evaluate the tradeoffs of these interconnections. \The Atlantic\" needs to be made into a link pointing to this: https://www.theatlantic.com/technology/archive/2017/08/why-cities-flood/538251/"
Geography 431 is designed to further understanding of the natural processes of …
Geography 431 is designed to further understanding of the natural processes of aquatic ecosystems, management of water resources, and threats to sustaining water quantity. Develop awareness and appreciation of the perspectives about water as a precious resource, commodity, and sometimes hazard. Learn how and why water is distributed unevenly around the Earth. Examine how resource management decisions are strongly related to water availability, quantity, and quality. The course examines water resources management; dams and dam removal; provision of safe potable water; threats to water quantity and quality; land use changes; the water economy; water laws and policy; institutions for water management at the global, national, regional, and local scale; and issues of water security and climate change.
Students first navigate to the University of California Museum of Paleontology "The …
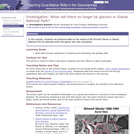
Students first navigate to the University of California Museum of Paleontology "The Geologic Timescale in Historical Perspective" website to answer a series of background questions about the geologic timescale. Students then navigate to the National Park Service Geologic Timescale website and use the Geologic Time Views Module to answer questions about major theories in geology and watch a video to answer questions about the age of the earth. Finally, students visit the National Climate Data Center "Exploring Weather & Climate Change Through the Powers of 10" website to answer questions about different scales of climate change.
(Note: this resource was added to OER Commons as part of a batch upload of over 2,200 records. If you notice an issue with the quality of the metadata, please let us know by using the 'report' button and we will flag it for consideration.)
This lab serves to introduce students to geologic time and serves as …
This lab serves to introduce students to geologic time and serves as an outline for the course through the semester.
Students use a tape register and must mark out the corresponding length of each Geologic Era and Eon towards the beginning of the course. Above Western time line Navajo students construct their own time line correlating events as best as possible. As the course progresses starting from 4.6bya each week they must draw major events that occur marking correct subdivisions of time and ages ago. As fossil life gets more complex such as beginning in the Paleozoic students are must take different categories of fossils or different periods so all are doing different things but working together. (Similarly the Navajo time line builds. This time line is taped around the room---and I would have liked to paint the two time lines along the corridor of the building but Maintenance axed it.
(Note: this resource was added to OER Commons as part of a batch upload of over 2,200 records. If you notice an issue with the quality of the metadata, please let us know by using the 'report' button and we will flag it for consideration.)
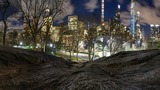
The online geology lab for community college students was developed during two years …
The online geology lab for community college students was developed during two years of forced online synchronous learning brought on by the COVID-19 pandemic. This open educational resource is a cohesive laboratory manual intended for two-year, non-major college students from the New York area. Each lab is accompanied by a Teacher’s Guide and an online answer sheet (formatted for the Blackboard learning management system). A multiple-choice format is used for many questions, making the labs easy to grade.
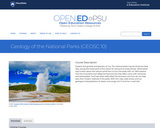
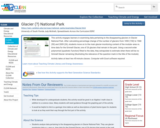
Geysers and grizzlies and glaciers, oh my. The national parks may be …
Geysers and grizzlies and glaciers, oh my. The national parks may be America's best idea, saving the finest parts of the nation for everyone to enjoy forever. What better way to learn about the natural world than to tour the parks with us? We'll explore how the mountains and valleys formed and why they often come with volcanoes and earthquakes. You'll see what really killed the dinosaurs and how we can help save their modern relatives in the parks. With film clips, slide shows, and our geological interpretations of classic rock songs, isn't it time for a road trip?
This lab, created by Salish Kootenai College faculty, steps undergraduate students through …
This lab, created by Salish Kootenai College faculty, steps undergraduate students through ordering, accessing, and graphing local precipitation and temperature data.
This is a simulation to explore how climate change will affect a …
This is a simulation to explore how climate change will affect a specific region in the coming decades. Graphs and maps in The Climate Explorer help students understand past, present, and future climate projections for their location.
This is a multi-media teaching tool to learn about climate change. The …
This is a multi-media teaching tool to learn about climate change. The tool is comprised of stills, video clips, graphic representations, and explanatory text about climate science. Acclaimed photographer James Balog and his Extreme Ice team put this teaching tool together.
This video is about Eunice Newton Foote, who studied the effect different …
This video is about Eunice Newton Foote, who studied the effect different gases have on the heat from the sun's rays. This is an engaging and funny video that describes the basis of climate science, while also discussing the hindering role of sexism in advancing science.
Students use historical data on the extent of the Grinnell Glacier in …
Students use historical data on the extent of the Grinnell Glacier in Glacier National Park to estimate when the glacier will melt completely.
(Note: this resource was added to OER Commons as part of a batch upload of over 2,200 records. If you notice an issue with the quality of the metadata, please let us know by using the 'report' button and we will flag it for consideration.)
This short video shows an example of melting alpine glaciers in the …
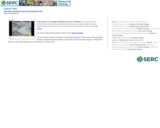
This short video shows an example of melting alpine glaciers in the Austrian Alps (Goldberg Glacier). Disappearing alpine glaciers have social and environmental impacts, including the decline of fresh water supplies and contributions to sea level rise.
This activity engages learners in examining data pertaining to the disappearing glaciers …
This activity engages learners in examining data pertaining to the disappearing glaciers in Glacier National Park. After calculating percentage change of the number of glaciers from 1850 (150) to 1968 (50) and 2009 (26), students move on to the main glacier-monitoring content of the module--area vs. time data for the Grinnell Glacier, one of 26 glaciers that remain in the park. Using a second-order polynomial (quadratic function) fitted to the data, they extrapolate to estimate when there will be no Grinnell Glacier remaining (illustrating the relevance of the question mark in the title of the module).
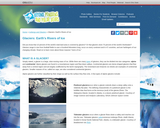
This article provides an overview of the types of glaciers, glacial formation, …
This article provides an overview of the types of glaciers, glacial formation, movement and retreat, and how scientists are studying glaciers and their response to climate change.
In this activity, students compare two photographs (with time spans of 30-100 …
In this activity, students compare two photographs (with time spans of 30-100 years between photos) of specific Alaskan glaciers to observe how glaciers have changed over the time interval. Activity is a good kickoff for learning about glaciology - how and why glaciers form, grow and shrink, and their relation to climate change.
In this activity students work with data to analyze local and global …
In this activity students work with data to analyze local and global temperature anomaly data to look for warming trends. The activity focuses on the Great Lakes area.
No restrictions on your remixing, redistributing, or making derivative works. Give credit to the author, as required.
Your remixing, redistributing, or making derivatives works comes with some restrictions, including how it is shared.
Your redistributing comes with some restrictions. Do not remix or make derivative works.
Most restrictive license type. Prohibits most uses, sharing, and any changes.
Copyrighted materials, available under Fair Use and the TEACH Act for US-based educators, or other custom arrangements. Go to the resource provider to see their individual restrictions.