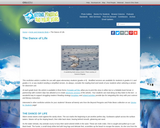
This nonfiction article, written for students in grades 4-5, explores the life …
This nonfiction article, written for students in grades 4-5, explores the life and seasonal migration of the sanderling bird. Modified versions are available for students in younger grades.
This activity is an entire-class lab experiment that refreshes the concepts of …
This activity is an entire-class lab experiment that refreshes the concepts of sinking and floating, while introducing the concepts of bouyancy and density using the fizz from sprite (carbon dioxide gas) and raisins.
By tracing the movement of radiation released during an accident at the …
By tracing the movement of radiation released during an accident at the Chernobyl nuclear power plant, students see how air pollution, like particulate matter, can become a global issue.
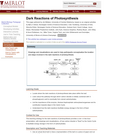
The dark reactions of photosynthesis (Calvin Cycle) are presented in this learning …
The dark reactions of photosynthesis (Calvin Cycle) are presented in this learning experience to show where these processes take place in the plant as well as the specific reactions involved.
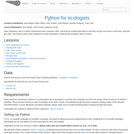
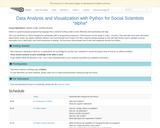
Python is a general purpose programming language that is useful for writing …
Python is a general purpose programming language that is useful for writing scripts to work effectively and reproducibly with data. This is an introduction to Python designed for participants with no programming experience. These lessons can be taught in one and a half days (~ 10 hours). They start with some basic information about Python syntax, the Jupyter notebook interface, and move through how to import CSV files, using the pandas package to work with data frames, how to calculate summary information from a data frame, and a brief introduction to plotting. The last lesson demonstrates how to work with databases directly from Python.
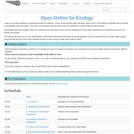
Data Carpentry lesson from Ecology curriculum to learn how to analyse and …
Data Carpentry lesson from Ecology curriculum to learn how to analyse and visualise ecological data in R. Data Carpentry’s aim is to teach researchers basic concepts, skills, and tools for working with data so that they can get more done in less time, and with less pain. The lessons below were designed for those interested in working with ecology data in R. This is an introduction to R designed for participants with no programming experience. These lessons can be taught in a day (~ 6 hours). They start with some basic information about R syntax, the RStudio interface, and move through how to import CSV files, the structure of data frames, how to deal with factors, how to add/remove rows and columns, how to calculate summary statistics from a data frame, and a brief introduction to plotting. The last lesson demonstrates how to work with databases directly from R.
Python is a general purpose programming language that is useful for writing …
Python is a general purpose programming language that is useful for writing scripts to work effectively and reproducibly with data. This is an introduction to Python designed for participants with no programming experience. These lessons can be taught in a day (~ 6 hours). They start with some basic information about Python syntax, the Jupyter notebook interface, and move through how to import CSV files, using the pandas package to work with data frames, how to calculate summary information from a data frame, and a brief introduction to plotting. The last lesson demonstrates how to work with databases directly from Python.
The Biology Semester-long Course was developed and piloted at the University of …
The Biology Semester-long Course was developed and piloted at the University of Florida in Fall 2015. Course materials include readings, lectures, exercises, and assignments that expand on the material presented at workshops focusing on SQL and R.
A part of the data workflow is preparing the data for analysis. …
A part of the data workflow is preparing the data for analysis. Some of this involves data cleaning, where errors in the data are identified and corrected or formatting made consistent. This step must be taken with the same care and attention to reproducibility as the analysis. OpenRefine (formerly Google Refine) is a powerful free and open source tool for working with messy data: cleaning it and transforming it from one format into another. This lesson will teach you to use OpenRefine to effectively clean and format data and automatically track any changes that you make. Many people comment that this tool saves them literally months of work trying to make these edits by hand.
This Library Carpentry lesson introduces archivists to working with data. At the …
This Library Carpentry lesson introduces archivists to working with data. At the conclusion of the lesson you will: be able to explain terms, phrases, and concepts in code or software development; identify and use best practice in data structures; use regular expressions in searches.
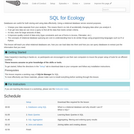
Databases are useful for both storing and using data effectively. Using a …
Databases are useful for both storing and using data effectively. Using a relational database serves several purposes. It keeps your data separate from your analysis. This means there’s no risk of accidentally changing data when you analyze it. If we get new data we can rerun a query to find all the data that meets certain criteria. It’s fast, even for large amounts of data. It improves quality control of data entry (type constraints and use of forms in Access, Filemaker, etc.) The concepts of relational database querying are core to understanding how to do similar things using programming languages such as R or Python. This lesson will teach you what relational databases are, how you can load data into them and how you can query databases to extract just the information that you need.
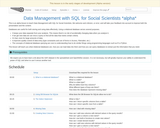
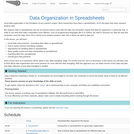
This is an alpha lesson to teach Data Management with SQL for …
This is an alpha lesson to teach Data Management with SQL for Social Scientists, We welcome and criticism, or error; and will take your feedback into account to improve both the presentation and the content. Databases are useful for both storing and using data effectively. Using a relational database serves several purposes. It keeps your data separate from your analysis. This means there’s no risk of accidentally changing data when you analyze it. If we get new data we can rerun a query to find all the data that meets certain criteria. It’s fast, even for large amounts of data. It improves quality control of data entry (type constraints and use of forms in Access, Filemaker, etc.) The concepts of relational database querying are core to understanding how to do similar things using programming languages such as R or Python. This lesson will teach you what relational databases are, how you can load data into them and how you can query databases to extract just the information that you need.
Good data organization is the foundation of any research project. Most researchers …
Good data organization is the foundation of any research project. Most researchers have data in spreadsheets, so it’s the place that many research projects start. We organize data in spreadsheets in the ways that we as humans want to work with the data, but computers require that data be organized in particular ways. In order to use tools that make computation more efficient, such as programming languages like R or Python, we need to structure our data the way that computers need the data. Since this is where most research projects start, this is where we want to start too! In this lesson, you will learn: Good data entry practices - formatting data tables in spreadsheets How to avoid common formatting mistakes Approaches for handling dates in spreadsheets Basic quality control and data manipulation in spreadsheets Exporting data from spreadsheets In this lesson, however, you will not learn about data analysis with spreadsheets. Much of your time as a researcher will be spent in the initial ‘data wrangling’ stage, where you need to organize the data to perform a proper analysis later. It’s not the most fun, but it is necessary. In this lesson you will learn how to think about data organization and some practices for more effective data wrangling. With this approach you can better format current data and plan new data collection so less data wrangling is needed.
Lesson on spreadsheets for social scientists. Good data organization is the foundation …
Lesson on spreadsheets for social scientists. Good data organization is the foundation of any research project. Most researchers have data in spreadsheets, so it’s the place that many research projects start. Typically we organize data in spreadsheets in ways that we as humans want to work with the data. However computers require data to be organized in particular ways. In order to use tools that make computation more efficient, such as programming languages like R or Python, we need to structure our data the way that computers need the data. Since this is where most research projects start, this is where we want to start too! In this lesson, you will learn: Good data entry practices - formatting data tables in spreadsheets How to avoid common formatting mistakes Approaches for handling dates in spreadsheets Basic quality control and data manipulation in spreadsheets Exporting data from spreadsheets In this lesson, however, you will not learn about data analysis with spreadsheets. Much of your time as a researcher will be spent in the initial ‘data wrangling’ stage, where you need to organize the data to perform a proper analysis later. It’s not the most fun, but it is necessary. In this lesson you will learn how to think about data organization and some practices for more effective data wrangling. With this approach you can better format current data and plan new data collection so less data wrangling is needed.
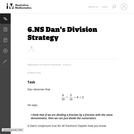
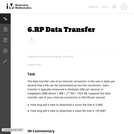
This task asks the students to solve a real-world problem involving unit …
This task asks the students to solve a real-world problem involving unit rates (data per unit time) using units that many teens and pre-teens have heard of but may not know the definition for. While the computations involved are not particularly complex, the units will be abstract for many students.
Data Carpentry lesson to learn how to use command-line tools to perform …
Data Carpentry lesson to learn how to use command-line tools to perform quality control, align reads to a reference genome, and identify and visualize between-sample variation. A lot of genomics analysis is done using command-line tools for three reasons: 1) you will often be working with a large number of files, and working through the command-line rather than through a graphical user interface (GUI) allows you to automate repetitive tasks, 2) you will often need more compute power than is available on your personal computer, and connecting to and interacting with remote computers requires a command-line interface, and 3) you will often need to customize your analyses, and command-line tools often enable more customization than the corresponding GUI tools (if in fact a GUI tool even exists). In a previous lesson, you learned how to use the bash shell to interact with your computer through a command line interface. In this lesson, you will be applying this new knowledge to carry out a common genomics workflow - identifying variants among sequencing samples taken from multiple individuals within a population. We will be starting with a set of sequenced reads (.fastq files), performing some quality control steps, aligning those reads to a reference genome, and ending by identifying and visualizing variations among these samples. As you progress through this lesson, keep in mind that, even if you aren’t going to be doing this same workflow in your research, you will be learning some very important lessons about using command-line bioinformatic tools. What you learn here will enable you to use a variety of bioinformatic tools with confidence and greatly enhance your research efficiency and productivity.
Software Carpentry lesson that teaches how to use databases and SQL In …
Software Carpentry lesson that teaches how to use databases and SQL In the late 1920s and early 1930s, William Dyer, Frank Pabodie, and Valentina Roerich led expeditions to the Pole of Inaccessibility in the South Pacific, and then onward to Antarctica. Two years ago, their expeditions were found in a storage locker at Miskatonic University. We have scanned and OCR the data they contain, and we now want to store that information in a way that will make search and analysis easy. Three common options for storage are text files, spreadsheets, and databases. Text files are easiest to create, and work well with version control, but then we would have to build search and analysis tools ourselves. Spreadsheets are good for doing simple analyses, but they don’t handle large or complex data sets well. Databases, however, include powerful tools for search and analysis, and can handle large, complex data sets. These lessons will show how to use a database to explore the expeditions’ data.
No restrictions on your remixing, redistributing, or making derivative works. Give credit to the author, as required.
Your remixing, redistributing, or making derivatives works comes with some restrictions, including how it is shared.
Your redistributing comes with some restrictions. Do not remix or make derivative works.
Most restrictive license type. Prohibits most uses, sharing, and any changes.
Copyrighted materials, available under Fair Use and the TEACH Act for US-based educators, or other custom arrangements. Go to the resource provider to see their individual restrictions.