A general statistics course, which includes understanding data, measures of central tendency, …
A general statistics course, which includes understanding data, measures of central tendency, measures of variation, binomial distributions, normal distributions, correlation and regression, probability and sampling distributions, Central Limit Theorem, confidence intervals, estimates of population parameters and hypothesis testing. Interpretation and data analysis are emphasized. PREREQUISITES: A grade of C or better in MAT 100 (Intermediate Algebra) or MAT 120 (Math Modeling for Liberal Arts) and placement above or successful completion of ENG 060 (Preparations for College Reading III). A student needs a thorough knowledge of Algebra, good reading skills and familiarity with the graphing calculator before entering this course.
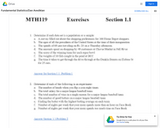
This text document lists detailed learning objectives for introductory statistics courses. Learning …
This text document lists detailed learning objectives for introductory statistics courses. Learning objectives are brief, clear statements of what learners will be able to perform at the end of a course.
Lecture for the course "CS 217 – Probability and Statistics for Computer …
Lecture for the course "CS 217 – Probability and Statistics for Computer Science" delivered at the City College of New York in Spring 2019 by Evan Agovino as part of the Tech-in-Residence Corps program.
This site teaches High Schoolers how to Make Inferences and Justify Conclusions …
This site teaches High Schoolers how to Make Inferences and Justify Conclusions using statistics through a series of 99 questions and interactive activities aligned to 4 Common Core mathematics skills.
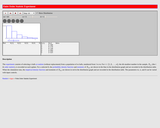
This resource consists of a Java applet and expository text. The applet …
This resource consists of a Java applet and expository text. The applet is a simulation of the experiment of selecting n objects at random from the first m positive integers. The random variables of interest are the order statistics. The applet illustrates the distributions of the order statistics.
An Excel-Based Approach Short Description: Introduction to Statistics: An Excel-Based Approach introduces …
An Excel-Based Approach
Short Description: Introduction to Statistics: An Excel-Based Approach introduces students to the concepts and applications of statistics, with a focus on using Excel to perform statistical calculations. The book is written at an introductory level, designed for students in fields other than mathematics or engineering, but who require a fundamental understanding of statistics. The text emphasizes understanding and application of statistical tools over theory, but some knowledge of algebra is required.
Long Description: Introduction to Statistics: An Excel-Based Approach introduces students to the concepts and applications of statistics, with a focus on using Excel to perform statistical calculations. The book is written at an introductory level, designed for students in fields other than mathematics or engineering, but who require a fundamental understanding of statistics. The text emphasizes understanding and application of statistical tools over theory, but some knowledge of algebra is required.
Word Count: 175351
(Note: This resource's metadata has been created automatically by reformatting and/or combining the information that the author initially provided as part of a bulk import process.)
This lesson combines conditional probability and combinations to determine the probability of …
This lesson combines conditional probability and combinations to determine the probability of picking a fair coin given that it flipped 4 out of 6 heads. [Probability playlist: Lesson 16 of 29]
Using the simple example of calculating the probability of reaching a traffic …
Using the simple example of calculating the probability of reaching a traffic light while green, students are shown how to build a mathematical model using a very commonly-taught formula (sum of first n integers) to solve a rather practical problem. This resource is from PUMAS - Practical Uses of Math and Science - a collection of brief examples created by scientists and engineers showing how math and science topics taught in K-12 classes have real world applications.
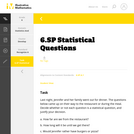
This is a task from the Illustrative Mathematics website that is one …
This is a task from the Illustrative Mathematics website that is one part of a complete illustration of the standard to which it is aligned. Each task has at least one solution and some commentary that addresses important aspects of the task and its potential use.
This course is a self-contained introduction to statistics with economic applications. Elements …
This course is a self-contained introduction to statistics with economic applications. Elements of probability theory, sampling theory, statistical estimation, regression analysis, and hypothesis testing. It uses elementary econometrics and other applications of statistical tools to economic data. It also provides a solid foundation in probability and statistics for economists and other social scientists. We will emphasize topics needed in the further study of econometrics and provide basic preparation for 14.32 Econometrics. No prior preparation in probability and statistics is required, but familiarity with basic algebra and calculus is assumed.
Introductory Statistics Course covering hypothesis testing, confidence interval, sampling, probability, counting techniques, correlation, linear regression, data collection and more.
Probability theory captures a number of essential characteristics of human cognition, including …
Probability theory captures a number of essential characteristics of human cognition, including aspects of perception, reasoning, belief revision, and learning. Expressions of degree of belief were used in language long before people began codifying the laws of probability theory. This course explores the history and debates over codifying the laws of probability, how probability theory applies to specific cognitive processes, how it relates to the human understanding of causality, and how new computational approaches to causal modeling provide a framework for understanding human probabilistic reasoning. This class is suitable for advanced undergraduates or graduate students specializing in cognitive science, artificial intelligence, and related fields.
Students explore the definition and interpretations of the probability of an event …
Students explore the definition and interpretations of the probability of an event by investigating the long run proportion of times a sum of 8 is obtained when two balanced dice are rolled repeatedly. Making use of hand calculations, computer simulations, and descriptive techniques, students encounter the laws of large numbers in a familiar setting. By working through the exercises, students will gain a deeper understanding of the qualitative and quantitative relationships between theoretical probability and long run relative frequency. Particularly, students investigate the proximity of the relative frequency of an event to its probability and conclude, from data, that the dispersion of the relative frequency diminishes on the order .
Introductory survey of quantitative methods (QM), or the application of statistics in …
Introductory survey of quantitative methods (QM), or the application of statistics in the workplace. Examines techniques for gathering, analyzing, and interpreting data in any number of fieldsĺÎĺ from anthropology to hedge fund management.
No restrictions on your remixing, redistributing, or making derivative works. Give credit to the author, as required.
Your remixing, redistributing, or making derivatives works comes with some restrictions, including how it is shared.
Your redistributing comes with some restrictions. Do not remix or make derivative works.
Most restrictive license type. Prohibits most uses, sharing, and any changes.
Copyrighted materials, available under Fair Use and the TEACH Act for US-based educators, or other custom arrangements. Go to the resource provider to see their individual restrictions.