Students use percents greater than 100% to solve problems about rainfall, revenue, …
Students use percents greater than 100% to solve problems about rainfall, revenue, snowfall, and school attendance.Key ConceptsPercents greater than 100% are useful in making comparisons between the values of a single quantity at two points in time. When a later value is more than 100% of an earlier value, it means the quantity has increased over time. This percent comparison can be used to find unknown values, whether the earlier or later value is unknown.Goals and Learning ObjectivesUnderstand the meaning of a percent greater than 100% in real-world situations.Use percents greater than 100% to interpret situations and solve problems.
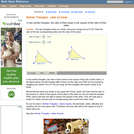
An interactive applet and associated web page that demonstrate that in similar …
An interactive applet and associated web page that demonstrate that in similar triangles, the ratio of their areas is the square of the ratio of the sides. As you drag one triangle to resize it, it remains similar to another and the ratios of sides and areas is calculated as you drag. One can be seen to be the square of the other at all times. A slight 'snap-to' effect allows easy selection of integer ratios (2:4 etc). Applet can be enlarged to full screen size for use with a classroom projector. This resource is a component of the Math Open Reference interactive geometry reference book project at http://www.mathopenref.com.
This Remote Learning Plan was created by Tami Hughson in collaboration with Tyler …
This Remote Learning Plan was created by Tami Hughson in collaboration with Tyler Cronin and Craig Hicks as part of the 2020 ESU-NDE Remote Learning Plan Project. Educators worked with coaches to create Remote Learning Plans as a result of the COVID-19 pandemic.The attached Remote Learning Plan is designed for 7th Grade Mathematics students. Students will use rates and proportions to solve problems. This Remote Learning Plan addresses the following NDE Standard: MA 7.2.3e
This three-panel figure is an infographic showing how carbon and oxygen isotope …
This three-panel figure is an infographic showing how carbon and oxygen isotope ratios, temperature, and carbonate sediments have changed during the Palaeocene-Eocene Thermal Maximum. The figure caption provides sources to scientific articles from which this data was derived. A graphic visualization from the Intergovernmental Panel on Climate Change shows the rapid decrease in carbon isotope ratios that is indicative of a large increase in the atmospheric greenhouse gases CO2 and CH4, which was coincident with approximately 5C of global warming.
Students interpret multiple categories of data about a hypothetical village population that …
Students interpret multiple categories of data about a hypothetical village population that represents the global population. They determine whether percent statements about the data are true or false.Key ConceptsData presented in multiple formats can be investigated using percent statements that facilitate comparisons between different parts of a whole. In using percents to interpret data, it is essential to be clear about what the part is and what the whole is. The whole in this lesson is a representative sample of the global population, which is used as a model for investigating variation across the population.Goals and Learning ObjectivesInterpret data presented in different formats in terms of percents.Identify percent statements as true or false, if possible, and explain the decision.Modify false percents statements to make them true.
Proportional relationships are everywhere. They are used to compare professional athletes and …
Proportional relationships are everywhere. They are used to compare professional athletes and to help shoppers get the “best bang for their buck” at the grocery store. They help us build models and designs and are used in many business applications. This lesson plan introduces proportional relationships, ratios and unit rates at the grade 6/7 (C) level and requires adult learners to identify and compare ratios using the Padlet application.
In Part 2 of this two-part lesson, students review and revise their …
In Part 2 of this two-part lesson, students review and revise their work on the Self Check task based on feedback from you and their peers and use what they’ve learned to solve similar problems.Key ConceptsStudents apply their knowledge, review their work, and make revisions based on feedback from you and their peers. This process creates a deeper understanding of the concepts.Goals and Learning ObjectivesUse feedback to refine solution strategies on the Self Check task.Deepen understanding of percent change.Apply deepened understanding to solve similar problems.
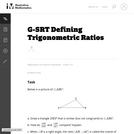
This is a task from the Illustrative Mathematics website that is one …
This is a task from the Illustrative Mathematics website that is one part of a complete illustration of the standard to which it is aligned. Each task has at least one solution and some commentary that addresses important asects of the task and its potential use. Here are the first few lines of the commentary for this task: Below is a picture of $\triangle ABC$: Draw a triangle $DEF$ which is similar (but not congruent) to $\triangle ABC$. How do $\frac{|DE|}{|DF|}$ and $\...
Ratio errors confuse a dodgeball coach as two teams face off in …
Ratio errors confuse a dodgeball coach as two teams face off in an epic tournament. See how mathematical techniques such as tables, graphs, measurements and equations help to find the missing part of a proportion.
Proportional relationships are everywhere. They are used to compare professional athletes and …
Proportional relationships are everywhere. They are used to compare professional athletes and to help shoppers get the “best bang for their buck” at the grocery store. They help us build models and designs and are used in many business applications. This lesson plan introduces proportional relationships, ratios and unit rates at the grade 6/7 (C) level and requires adult learners to identify and compare ratios using the Padlet application.
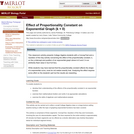
This classroom activity presents College Algebra students with a ConcepTest and a …
This classroom activity presents College Algebra students with a ConcepTest and a Question of the Day activity concerning the effect of the proportionality constant, k, on the y-intercept and position of an exponential graph where k<0 and C is an arbitrarily fixed value in f(x)=Ce^(kx).
This lesson takes the learner through a series of exercises where the …
This lesson takes the learner through a series of exercises where the ability to understand ratios and calculate unit cost will help the learner make optimal, well-reasoned, cost-effective purchasing decisions. The target audience is the adult learner (preferably with school-age children) working in the Grade D range (6th-8th grade) and with RP Domain (Ratios and Proportional Relationships). Learners will benefit by seeing the relationship that mathematical concepts have to their everyday lives by using mathematical reasoning to make better purchasing decisions. Mastery of this material will help learners demonstrate readiness for higher-level algebraic concepts.
This classroom activity presents College Algebra students with a ConcepTest and a …
This classroom activity presents College Algebra students with a ConcepTest and a Question of the Day activity concerning the effect of the proportionality constant, k, on the y-intercept and position of an exponential graph where k>0 and C is an arbitrarily fixed value in f(x)=Ce^(kx).
Students will calculate the glide slope ratio and angle of paper airplanes …
Students will calculate the glide slope ratio and angle of paper airplanes they have created. They will make claims about the type of airplane and support claims with evidence and reasoning from their class data.
Seeing that the surface area to volume ratio of cells generally decreases …
Seeing that the surface area to volume ratio of cells generally decreases as cells get larger, making the exchange of resources, waster and heat more and more difficult.
Lesson OverviewStudents solve problems using equations of the form x + p …
Lesson OverviewStudents solve problems using equations of the form x + p = q and px = q, as well as problems involving proportions.Key ConceptsStudents will extend what they know about writing expressions to writing equations. An equation is a statement that two expressions are equivalent. Students will write two equivalent expressions that represent the same quantity. One expression will be numerical and the other expression will contain a variable.It is important that when students write the equation, they define the variable precisely. For example, n represents the number of minutes Aiko ran, or x represents the number of boxes on the shelf.Students will then solve the equations and thereby solve the problems.Students will solve proportion problems by solving equations. This makes sense because a proportion such as xa=bc is really just an equation of the form xp = q where p=1a and q=bc.Students will also compare their algebraic solutions to an arithmetic solution for the problem. They will see, for example, that a problem that might be solved arithmetically by subtracting 5 from 78 can also be solved algebraically by solving x + 5 = 78, where 5 is subtracted from both sides—a parallel solution to subtracting 5 from 78.Goals and Learning ObjectivesUse equations of the form x + p = q and xp = q to solve problems.Solve proportion problems using equations.ELL: ELLs may have difficulty verbalizing their reasoning, particularly because word problems are highly language dependent. Accommodate ELLs by providing extra time for them to process the information. Note that this problem is a good opportunity for ELLs to develop their literacy skills since it incorporates reading, writing, listening, and speaking skills. Encourage students to challenge each others' ideas and justify their thinking using academic and specialized mathematical language.
Why are Cells Small? was developed as part of an effort by …
Why are Cells Small? was developed as part of an effort by the Quantitative Biology at Community Colleges group to provide materials that incorporate mathematical concepts into biology courses. The activity was designed for a non-majors biology course, and maps to Chapter 4 of the OpenStax Biology 2e textbook. This activity could also be used in a mathematics course as a biologically relevant example.
After completing this module students should be able to:
- Explain the relationship of surface area to volume - Describe the importance of a large surface area to volume ratio in the context of a living cell - Calculate surface area of cubes and spheres - Calculate volume of cubes and spheres - Express two values as a ratio - Enter data into a table - Interpret Tables - Create a graph - Describe the axis labels on graphs - Interpret graphs This material is based upon work supported by the National Science Foundation under Grant No. 1919613. Any opinions, findings, and conclusions or recommendations expressed in this material are those of the author(s) and do not necessarily reflect the views of the National Science Foundation.
This is a task from the Illustrative Mathematics website that is one …
This is a task from the Illustrative Mathematics website that is one part of a complete illustration of the standard to which it is aligned. Each task has at least one solution and some commentary that addresses important aspects of the task and its potential use.
No restrictions on your remixing, redistributing, or making derivative works. Give credit to the author, as required.
Your remixing, redistributing, or making derivatives works comes with some restrictions, including how it is shared.
Your redistributing comes with some restrictions. Do not remix or make derivative works.
Most restrictive license type. Prohibits most uses, sharing, and any changes.
Copyrighted materials, available under Fair Use and the TEACH Act for US-based educators, or other custom arrangements. Go to the resource provider to see their individual restrictions.