This activity is an introduction to the water cycle where students will …
This activity is an introduction to the water cycle where students will use observation, drawing, writing, recording, questioning, and communication to understand the concept of condensation.
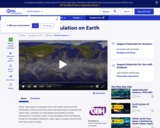
This simulation from the National Center for Atmospheric Research portrays annual patterns …
This simulation from the National Center for Atmospheric Research portrays annual patterns in water vapor and precipitation across the globe, illustrating general circulation patterns as well as seasonal and regional variation.
In this activity, students learn to interpret current weather maps. They will …
In this activity, students learn to interpret current weather maps. They will observe weather map loop animations on the internet, learn the concept of Zulu time (Universal Time Coordinated, UTC) and visualize the movement of fronts and air masses. They will then analyze a specific weather station model, generate a meteogram from their observations, and answer a set of questions about their observations.
Students are introduced to some essential meteorology concepts so they more fully …
Students are introduced to some essential meteorology concepts so they more fully understand the impact of meteorological activity on air pollution control and prevention. First, they develop an understanding of the magnitude and importance of air pressure. Next, they build a simple aneroid barometer to understand how air pressure information is related to weather prediction. Then, students explore the concept of relative humidity and its connection to weather prediction. Finally, students learn about air convection currents and temperature inversions. In an associated literacy activity, students learn how scientific terms are formed using Latin and Greek roots, prefixes and suffixes, and are introduced to the role played by metaphor in language development. Note: Some of these activities can be conducted simultaneously with the air quality activity (What Color Is Your Air Today?) of Air Pollution unit, Lesson 1.
This activity is a field investigation where students gather weather cycle data …
This activity is a field investigation where students gather weather cycle data on seasons and climate. They will graph their observations, share with others and connect weather and seasons together.
In this exercise, students investigate long-term weather variables such as temperature and …
In this exercise, students investigate long-term weather variables such as temperature and humidity to determine their affect on the climate of a particular region. They will choose two cities, use an online resource to obtain geographic and climatic information for each, and use a spreadsheet program to produce graphs that compare data for the two cities.
In this activity, students investigate the mass, pressure, and temperature of air. …
In this activity, students investigate the mass, pressure, and temperature of air. They will measure and record the mass and temperature of a bottle of air as they increase its pressure by pumping in more air, record their observations, and answer some questions about what they have seen.
This activity is a daily lab where two students read a thermometer …
This activity is a daily lab where two students read a thermometer and identify the cloud type for a week. They record it on the board first and we all record it in our journals. A graph of the entire year is also completed and we can analyze the data as we go. We get two new "scientists" each week and we do it all year. I start the first week of school.
In this activity, students use METeorological Aerodome Reports (METARs) to view changes …
In this activity, students use METeorological Aerodome Reports (METARs) to view changes in temperature, dew point, air pressure, sky condition, wind, and visibility at White Plains, New York. After studying the reports, they answer a series of questions related to radiation and insolation, radiative balance, and meteorological processes.
In this week-long unit, students examine weather reports from all over the …
In this week-long unit, students examine weather reports from all over the world in order to understand global temperature patterns. Throughout the unit, students collect their findings in a portfolio. The comprehensive curriculum materials contain teacher tools, a Web activity in which students examine 12 months of weather data for several U.S. cities, comparing their findings with the same 12 months at Antarctica weather stations, two hands-on experiments, two Q&A interviews and a student handout with guidance for putting together their portfolios and examples of creative final projects.
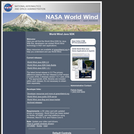
This site features World Wind 1.3, a NASA Learning Technologies application that …
This site features World Wind 1.3, a NASA Learning Technologies application that lets the user zoom from any satellite altitude into any place on Earth. It features 3D Engine, Blue Marble, Landsat 7, SRTM, Animated Earth, MODIS, GLOBE, Country & State Borders, Place Names, Visual Tools and Landmark Set. The user can download World Wind, reference an online manual, post to an online forum, view screen shot examples from various satellites, and read press coverage about World Wind.
This resource is a video abstract of a research paper created by …
This resource is a video abstract of a research paper created by Research Square on behalf of its authors. It provides a synopsis that's easy to understand, and can be used to introduce the topics it covers to students, researchers, and the general public. The video's transcript is also provided in full, with a portion provided below for preview:
"Flooding affects nearly 21 million people and costs over 96 billion dollars worldwide every year. And South Asia is one of the hardest hit areas. If flood conditions were better forecasted, then at-risk communities might have a chance at avoiding flood disasters. But adequate preparation requires at least 5 to 10 days advance notice of a flood, and in South Asia, a lack of information on rainfall and river conditions is an ongoing forecasting challenge. Now, researchers have created a model that can provide earlier warning of flood conditions using easy-to-access data. The model, named ReqSim , tracks key features of basin hydrology using the principle of requisite simplicity to balance modeling complexity and utility. Using rainfall data, basin topography, and day-to-day persistence of river conditions, the model offers greater insight into the likelihood of flooding than other commonly used approaches..."
The rest of the transcript, along with a link to the research itself, is available on the resource itself.
No restrictions on your remixing, redistributing, or making derivative works. Give credit to the author, as required.
Your remixing, redistributing, or making derivatives works comes with some restrictions, including how it is shared.
Your redistributing comes with some restrictions. Do not remix or make derivative works.
Most restrictive license type. Prohibits most uses, sharing, and any changes.
Copyrighted materials, available under Fair Use and the TEACH Act for US-based educators, or other custom arrangements. Go to the resource provider to see their individual restrictions.