In this model eliciting activity (MEA), students are hired by a travel …
In this model eliciting activity (MEA), students are hired by a travel magazine to determine if two airlines that fly into Chicago are equally reliable. They examine data of flight arrival delay times for both airlines flying out of the same city. They first identify measures that can be used to compare the two airlines. Working in small groups, the students decide the size of a meaningful difference between the airlines for each measure and use that information to determine a rule that for deciding if one airline is more reliable than another. The students apply their rule to flight arrival delay data for the two airlines from four additional departure cities, and use the results to write a report to the magazine editor on whether or not one airline is more reliable than the other. This activity can serve as an introduction to ideas of central tendency and variability, and prepares students for formal approaches to comparing groups.
This assignment exposes students to data on economic growth and development as …
This assignment exposes students to data on economic growth and development as commonly measured by per capita GDP and the Human Development Index (HDI) for 100 countries of the world. There is a big debate about how good an indicator HDI is compared to GDP per capita as a measure of development.
This course is an introduction to computational theories of human cognition. Drawing …
This course is an introduction to computational theories of human cognition. Drawing on formal models from classic and contemporary artificial intelligence, students will explore fundamental issues in human knowledge representation, inductive learning and reasoning. What are the forms that our knowledge of the world takes? What are the inductive principles that allow us to acquire new knowledge from the interaction of prior knowledge with observed data? What kinds of data must be available to human learners, and what kinds of innate knowledge (if any) must they have?
The course focuses on casting contemporary problems in systems biology and functional …
The course focuses on casting contemporary problems in systems biology and functional genomics in computational terms and providing appropriate tools and methods to solve them. Topics include genome structure and function, transcriptional regulation, and stem cell biology in particular; measurement technologies such as microarrays (expression, protein-DNA interactions, chromatin structure); statistical data analysis, predictive and causal inference, and experiment design. The emphasis is on coupling problem structures (biological questions) with appropriate computational approaches.
This subject is a computer-oriented introduction to probability and data analysis. It …
This subject is a computer-oriented introduction to probability and data analysis. It is designed to give students the knowledge and practical experience they need to interpret lab and field data. Basic probability concepts are introduced at the outset because they provide a systematic way to describe uncertainty. They form the basis for the analysis of quantitative data in science and engineering. The MATLAB® programming language is used to perform virtual experiments and to analyze real-world data sets, many downloaded from the web. Programming applications include display and assessment of data sets, investigation of hypotheses, and identification of possible casual relationships between variables. This is the first semester that two courses, Computing and Data Analysis for Environmental Applications (1.017) and Uncertainty in Engineering (1.010), are being jointly offered and taught as a single course.
This course introduces abstraction as an important mechanism for problem decomposition and …
This course introduces abstraction as an important mechanism for problem decomposition and solution formulation in the biomedical domain, and examines computer representation, storage, retrieval, and manipulation of biomedical data. As part of the course, we will briefly examine the effect of programming paradigm choice on problem-solving approaches, and introduce data structures and algorithms. We will also examine knowledge representation schemes for capturing biomedical domain complexity and principles of data modeling for efficient storage and retrieval. The final project involves building a medical information system that encompasses the different concepts taught in the course. Computer science basics covered in the first part of the course are integral to understanding topics covered in the latter part, and for completing the assigned homework.
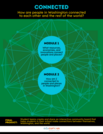
This unit is designed to build inquiry about and interest in the …
This unit is designed to build inquiry about and interest in the themes and topics woven throughout Educurious’s multi-unit Washington State History course. To start off, students discover and share how they are connected to their classmates by participating in a “Web of Connectedness” activity. Throughout the unit, students engage in mapping, data visualization, and cost-benefit analyses in order to unpack the theme of connectedness and answer the unit driving question: How are people in Washington connected to each other and the rest of the world? As students learn about resources, economies, innovations, people, and places in Washington, they draft a series of six interactive community boards that educate others about the ways in which people are connected. For the culminating product of this unit, student teams finalize one of their six draft community boards to help students in their school make connections between themselves, Washington, and the world.
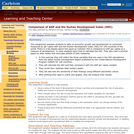
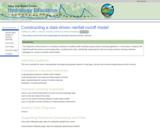
The objective of this lesson is to introduce students to rainfall-runoff modeling …
The objective of this lesson is to introduce students to rainfall-runoff modeling using machine learning algorithms. In this lesson, students will walk through the process of accessing data, visualizing the data, statistically analyzing the data and using machine learning software packages to construct rainfall-runoff models.
(Note: this resource was added to OER Commons as part of a batch upload of over 2,200 records. If you notice an issue with the quality of the metadata, please let us know by using the 'report' button and we will flag it for consideration.)
Why study Quantitative Literacy? Most students sign up for this course to …
Why study Quantitative Literacy?
Most students sign up for this course to fulfill a general education mathematics requirement. And this text is certainly aimed at that general audience. But by the time the course is completed, the authors hope that you will have developed some appreciation for the usefulness and elegance of the subject. Without doubt, some level of competency and comfort in working with numerical data is needed to navigate the modern world; and we have tried to cover topics that can be used in day to day life.
In this book, we will focus on problem solving and critical thinking skills. Our goal is not to prepare you just for the next math class, but to equip you with the necessary tools so that you can apply basic mathematical reasoning to a wide variety of commonly encountered problems. Along the way, we will learn basic logic, how to work with percentages and units, the basics of consumer finance, and how to use and interpret basic statistical data.
Infographics have become popular. One reason is that you can visually display …
Infographics have become popular. One reason is that you can visually display information. I am encouraging you to create an infographic about your informational interview. This provides some examples.
CMS.611J / 6.073 Creating Video Games is a class that introduces students …
CMS.611J / 6.073 Creating Video Games is a class that introduces students to the complexities of working in small, multidisciplinary teams to develop video games. Students will learn creative design and production methods, working together in small teams to design, develop, and thoroughly test their own original digital games. Design iteration across all aspects of video game development (game design, audio design, visual aesthetics, fiction and programming) will be stressed. Students will also be required to focus test their games, and will need to support and challenge their game design decisions with appropriate focus testing and data analysis.
This activity asks students to work in a team to develop a …
This activity asks students to work in a team to develop a set of rules that can be used to program a SPAM filter for a client. The rules are based on characteristics of the subject lines of emails. Students are given samples of SPAM and non-SPAM subject lines to examine. After their rules are ready, they are given a test set of data to use and are asked to come up with a numerical measure to quantify how well their method (model) works. Each team writes a report describing how their model works and how well it performed on the test data. This activity could serve as an introduction to ideas of classification. Alternatively, the activity could be the basis for student introduction to types of statistical errors.
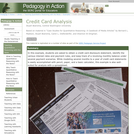
In this example, students are asked to obtain a credit card disclosure …
In this example, students are asked to obtain a credit card disclosure statement, identify the various interest rates and payment rules, and keep track of a revolving monthly balance under several payment scenarios. While modeling several months to a year of credit card statements is easily accomplished with pencil, paper, and a basic calculator, this example is also well-suited for analysis with a spreadsheet.
Strategies to Effectively Interpret and Evaluate Data Visualizations Short Description: A short …
Strategies to Effectively Interpret and Evaluate Data Visualizations
Short Description: A short course for students to increase their proficiency in analyzing and interpreting data visualizations. By completing this short course students will be able to explain the importance of data literacy, identify data visualization issues in order to improve their own skills in data story-telling. The intended outcome of this course is to help students become more discerning and critical users of data, graphs, charts and infographics.
Word Count: 9819
(Note: This resource's metadata has been created automatically by reformatting and/or combining the information that the author initially provided as part of a bulk import process.)
A perfect introduction to the exploding field of Data Science for the …
A perfect introduction to the exploding field of Data Science for the curious, first-time student. The author brings his trademark conversational tone to the important pillars of the discipline: exploratory data analysis, choices for structuring data, causality, machine learning principles, and introductory Python programming using open-source Jupyter Notebooks. This engaging read will allow any dedicated learner to build the skills necessary to contribute to the Data Science revolution, regardless of background.
You may have already had to digitize a curve from an original …
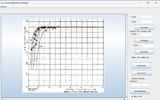
You may have already had to digitize a curve from an original document in the form of an image, which is quite tedious to do by hand.
To facilitate the digitization of curves, we have created a small utility that allows you to display on the screen the previously scanned image of a graph, then to very easily record the points of the curves you are interested in (up to 2000).
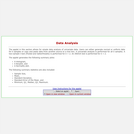
The applet in this section allows for simple data analysis of univariate …
The applet in this section allows for simple data analysis of univariate data. Users can either generate normal or uniform data for k samples or copy and paste data from another source to a text box. A univariate analysis is performed for all k samples.
Are you ready to leave the sandbox and go for the real …
Are you ready to leave the sandbox and go for the real deal? Have you followed Data Analysis: Take It to the MAX() and Data Analysis: Visualization and Dashboard Design and are ready to carry out more robust data analysis?
In this project-based course you will engage in a real data analysis project that simulates the complexity and challenges of data analysts at work. Testing, data wrangling, Pivot Tables, sparklines? Now that you have mastered them you are ready to apply them all and carry out an independent data analysis.
For your project, you will pick one raw dataset out of several options, which you will turn into a dashboard. You will begin with a business question that is related to the dataset that you choose. The datasets will touch upon different business domains, such as revenue management, call-center management, investment, etc.
Using two different coins and recording the results of both coins helps …
Using two different coins and recording the results of both coins helps students dispel this initial misconception as they analyze the graph results. Class discussion should focus on analyzing the data to determine if the game is fair or not. Directions and gameboard are included in the download.
No restrictions on your remixing, redistributing, or making derivative works. Give credit to the author, as required.
Your remixing, redistributing, or making derivatives works comes with some restrictions, including how it is shared.
Your redistributing comes with some restrictions. Do not remix or make derivative works.
Most restrictive license type. Prohibits most uses, sharing, and any changes.
Copyrighted materials, available under Fair Use and the TEACH Act for US-based educators, or other custom arrangements. Go to the resource provider to see their individual restrictions.