Updating search results...

Search Resources

1055 Results

View
Selected filters:
Random Walk III
Unrestricted Use
CC BY
Rating
0.0 stars

This task provides a context to calculate discrete probabilities and represent them on a bar graph. It could also be used to create a class activity where students gather, represent, and analyze data, running simulations of the random walk and recording and then displaying their results.

Subject:
Mathematics
Material Type:
Activity/Lab
Provider:
Illustrative Mathematics
Provider Set:
Illustrative Mathematics
Author:
Illustrative Mathematics
Date Added:
06/06/2012
Random Walk IV
Unrestricted Use
CC BY
Rating
0.0 stars

This task completes the line of reasoning of Random Walk III in a situation where the numbers become too large to calculate and so abstract reasoning is required in order to compare the different probabilities. It is intended for instructional purposes only with a goal of understanding how to calculate and compare the combinatorial symbols.

Subject:
Mathematics
Material Type:
Activity/Lab
Provider:
Illustrative Mathematics
Provider Set:
Illustrative Mathematics
Author:
Illustrative Mathematics
Date Added:
06/06/2012
Random error
Only Sharing Permitted
CC BY-NC-ND
Rating
0.0 stars

An important consideration when sampling from a population is that of random error (also known as sampling error), which results from chance variation in the members of any sample taken from a larger population. Random error may affect the conclusions you draw from a study by affecting the precision of a descriptive study, or the power of an analytic study. However, although the magnitude of random error can be quantified to some degree, its direction cannot be predicted due to its random nature. Random errors can be accounted for to some degree through the application of inferential statistics when presenting and interpreting results.

Subject:
Life Science
Material Type:
Diagram/Illustration
Reading
Provider:
WikiVet
Provider Set:
Veterinary Epidemiology
Date Added:
02/27/2015
Rats Quitting The Ship
Unrestricted Use
Public Domain
Rating
0.0 stars

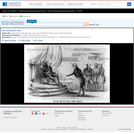
Postmaster general Amos Kendall's 1840 resignation prompted the artist's speculation on the desertion of other Van Buren cabinet members. Kendall resigned on May 16, to concentrate on editing the "Extra Globe," a Democratic campaign newspaper. The artist also echoes Whig charges of White House extravagance under Van Buren, and rumors (well-founded) of the lucrative financial benefits of Kendall's new post. The President sits on a throne on a dais, as Kendall bows before him tendering his resignation. Three other advisors caucus in the background. They are (left to right) Treasury Secretary Levi Woodbury, Secretary of State John Forsyth, and editor Francis Preston Blair. Woodbury and Forsyth both hold their resignations. Kendall: "Your excellency please accept my resignation My health is very feeble. I've made no money in office, and Blair is to give me the profits of the Extra Globe. I must go back to editing Newspapers." Before accepting a cabinet post in the Jackson administration, Kendall had been a highly successful editor. Van Buren: "This is a very inauspicious time my Friends to dissolve the Cabinet. It really looks as if I am to be abandoned." Woodbury: "What's to become of me? Am I not to go to Russia France or England? We must provide for the family." Forsyth: "I wish to resign provided I can do it profitably; a foreign Mission is just the thing." Blair: "Dont all desert us. The Whigs will make capital out of this be sure of it." Contrary to the cartoonist's prediction, no cabinet resignations other than Kendall's were forthcoming.|Printed & published by H.R. Robinson, no. 52 Cortlandt St. N.Y. & Pennsa. Avenue Washington D.C.|Signed with monogram: HD (Henry Dacre?).|Title appears as it is written on the item.|Weitenkampf, p. 68.|Forms part of: American cartoon print filing series (Library of Congress)|Published in: American political prints, 1766-1876 / Bernard F. Reilly. Boston : G.K. Hall, 1991, entry 1840-34.

Subject:
History
U.S. History
Material Type:
Diagram/Illustration
Primary Source
Provider:
Library of Congress
Provider Set:
Library of Congress - Cartoons 1766-1876
Date Added:
06/08/2013
Reading Comprehension
Unrestricted Use
CC BY
Rating
0.0 stars

Reading Comprehension is to fully understand the content read By analyzing, interpreting and summarizing information appearing in the content. This is important in developing a person's reading and learning skills. Reading materials can be books, documents, articles, or other resources.Understanding reading content occurs through analytical thinking, prediction, and knowledge linking. and awareness and control of one's own learning while reading. It is an important skill that humans must develop in order to learn and succeed in daily life.

Subject:
Reading Informational Text
Material Type:
Reading
Author:
Nipitpon Bunthep
Date Added:
03/05/2024
Reading Like a Historian: Truman and MacArthur
Read the Fine Print
Rating
0.0 stars

In this lesson, students analyze primary source documents in an effort to answer the central historical question: How did Americans respond to President Truman‰ŰŞs decision to fire General MacArthur? The teacher begins by explaining how MacArthur wanted to invade China to resolve the Korean War stalemate in 1951 and why Truman fired him for insubordination. Students are asked to make a prediction: what do you think the reaction was to the firing of this popular general? Students then analyze 3 documents: 1) a memo to Truman tabulating the letters he received after the firing (pro vs. con), 2) a letter by AMVETS supporting the firing, and 3) a very critical letter from a woman in Texas. For the last 2, students answer questions on a graphic organizer in groups. A whole group discussion follows and a quick debriefing on the impacts of the war's conclusion are presented.

Subject:
History
U.S. History
Material Type:
Lesson
Provider:
Stanford History Education Group
Provider Set:
Reading Like a Historian
Date Added:
11/04/2012
Reading log summary
Conditional Remix & Share Permitted
CC BY-SA
Rating
0.0 stars

After reading your 'free choice' selection - please answer the following questions on a separate piece of paper. 1) Tell me three things that happened in your reading today? 2) Why did you pick those things? How do they relate to the story as a whole?3) What do you will predict will happen next? Why do you think that? (use evidence to support your answer)

Subject:
Reading Literature
Material Type:
Lesson Plan
Author:
Sarah Reser
Date Added:
03/28/2017
Ready to Erupt!
Read the Fine Print
Educational Use
Rating
0.0 stars

Students observe an in-classroom visual representation of a volcanic eruption. The water-powered volcano demonstration is made in advance, using sand, hoses and a waterballoon, representing the main components of all volcanoes. During the activity, students observe, measure and sketch the volcano, seeing how its behavior provides engineers with indicators used to predict an eruption.

Subject:
Applied Science
Engineering
Geology
Physical Science
Material Type:
Activity/Lab
Provider:
TeachEngineering
Provider Set:
TeachEngineering
Author:
Denise W. Carlson
Geoffrey Hill
Malinda Schaefer Zarske
Date Added:
10/14/2015
Real Estate Economics
Conditional Remix & Share Permitted
CC BY-NC-SA
Rating
0.0 stars

This course, offered by the MIT Center for Real Estate, focuses on developing an understanding of the macroeconomic factors that shape and influence markets for real property. We will develop the theory of land markets and locational choice. The material covered includes studies of changing economic activities, demographic trends, transportation and local government behavior as they affect real estate.

Subject:
Business and Communication
Economics
Political Science
Social Science
Material Type:
Full Course
Provider:
MIT
Provider Set:
MIT OpenCourseWare
Author:
Wheaton, William
Date Added:
09/01/2008
Real-World Applications for Analytics Teaching and Learning
Conditional Remix & Share Permitted
CC BY-NC-SA
Rating
0.0 stars

This document provides learning-by-doing materials for Analytics software skill development using SAS JMP. It integrates Analytics concepts and techniques with real-world scenarios based on the COVID-19 pandemic to illustrate how real-world data can be transformed into actionable insights to offer decision support for COVID-19 related issues. A holistic treatment of the Analytics process from data acquisition and cleansing to data analysis and interpretation is emphasized using five studies:
Characterize COVID-19 mortality demographic risk factors,
Visualize COVID-19 mortality demographics,
Conduct COVID-19 mortality time series forecasting,
Predict COVID-19 mortality, and
Analyze COVID-19 vaccine acceptance, uptake, and experiences.

Each study is structured with guiding questions to engage students to think critically, relate Analytic concepts to the given situation, and arrive at their own answers/solutions for active knowledge exploration and discovery.

Subject:
Mathematics
Measurement and Data
Material Type:
Homework/Assignment
Provider:
University of Kentucky
Author:
Anita Lee-Post
Date Added:
12/08/2021
Relationship between mineral weathering and groundwater composition
Conditional Remix & Share Permitted
CC BY-NC-SA
Rating
0.0 stars

In this pair of activities, students start by using published data to predict what will happen to groundwater composition as a consequence of chemical weathering. The data are provided in a spreadsheet (Hinman_weathering). Students are given the histograms only; both are normalized to 100 %, while one includes silica and the other does not. Students must use resources to predict how groundwater composition will change as a consequence of the observed weathering, and support those predictions using balanced chemical-weathering equations. Afterwards, they conduct a laboratory experiment in which they subject crushed rock to four types of solutions (acid solution, organic-rich solution, rainwater, and alkaline solution). The pH of each solution is measured, and subsequently adjusted after 24 and 48 hours. Solutions are sampled after 14 days. They are analyzed by ICP, and the compositions reported to students for comparison with their predictions.

(Note: this resource was added to OER Commons as part of a batch upload of over 2,200 records. If you notice an issue with the quality of the metadata, please let us know by using the 'report' button and we will flag it for consideration.)

Subject:
Biology
Chemistry
Life Science
Physical Science
Material Type:
Activity/Lab
Provider:
Science Education Resource Center (SERC) at Carleton College
Provider Set:
Teach the Earth
Author:
Nancy Hinman
Date Added:
08/17/2019
Remodeling of the maternal gut microbiome during pregnancy is shaped by parity
Unrestricted Use
CC BY
Rating
0.0 stars

This resource is a video abstract of a research paper created by Research Square on behalf of its authors. It provides a synopsis that's easy to understand, and can be used to introduce the topics it covers to students, researchers, and the general public. The video's transcript is also provided in full, with a portion provided below for preview:

"In mammals, the maternal microbiome influences both mother and infant health and can be used to predict the likelihood of preterm birth. The mother’s number of previous pregnancies, or parity, can also affect preterm birth risk, but whether parity influences the maternal or infant microbiome is unclear. A recent study used marker gene sequencing and metagenomics analyses of stool samples to investigate the microbiomes of pregnant pigs of different parities and their offspring. Microbiome “maturity index” and Dirichlet multinomial mixtures (DMM) model analyses indicated that the sow microbiome changed in predictable ways throughout pregnancy and that the changes occurred more rapidly in sows with higher numbers of previous pregnancies. Parity (high vs. zero) was linked to the levels of specific types of bacteria in the maternal gut at the end of pregnancy. Sow parity also affected the abundances of certain metabolism-related bacteria in the piglet gut 10 days after birth..."

The rest of the transcript, along with a link to the research itself, is available on the resource itself.

Subject:
Biology
Life Science
Material Type:
Diagram/Illustration
Reading
Provider:
Research Square
Provider Set:
Video Bytes
Date Added:
10/13/2021
Representing Data 1: Using Frequency Graphs
Only Sharing Permitted
CC BY-NC-ND
Rating
0.0 stars

This lesson unit is intended to help teachers assess how well students: are able to use frequency graphs to identify a range of measures and make sense of this data in a real-world context; and understand that a large number of data points allow a frequency graph to be approximated by a continuous distribution.

Subject:
Mathematics
Measurement and Data
Statistics and Probability
Material Type:
Assessment
Lesson Plan
Provider:
Shell Center for Mathematical Education
Provider Set:
Mathematics Assessment Project (MAP)
Date Added:
04/26/2013
Representing Data 2: Using Box Plots
Only Sharing Permitted
CC BY-NC-ND
Rating
0.0 stars

This lesson unit is intended to help teachers assess how well students are able to interpret data using frequency graphs and box plots. In particular this unit aims to identify and help students who have difficulty figuring out the data points and spread of data from frequency graphs and box plots. It is advisable to use the lesson: Representing Data 1: Frequency Graphs, before this one.

Subject:
Mathematics
Measurement and Data
Statistics and Probability
Material Type:
Assessment
Lesson Plan
Provider:
Shell Center for Mathematical Education
Provider Set:
Mathematics Assessment Project (MAP)
Date Added:
04/26/2013
Research Methods in Psychology
Conditional Remix & Share Permitted
CC BY-NC-SA
Rating
0.0 stars

3rd American Edition

Short Description:
This third American edition is a comprehensive textbook for research methods classes. It is an adaptation of the second American edition.

Long Description:
This textbook is an adaptation of one written by Paul C. Price (California State University, Fresno) and adapted by The Saylor Foundation under a Creative Commons Attribution-NonCommercial-ShareAlike 3.0 License without attribution as requested by the work’s original creator or licensee. The original text is available here: http://www.saylor.org/site/textbooks/

The first Canadian edition (published in 2013) was authored by Rajiv S. Jhangiani (Kwantlen Polytechnic University) and was licensed under a Creative Commons Attribution-NonCommercial-ShareAlike 3.0 License. Revisions included the addition of a table of contents, changes to Chapter 3 (Research Ethics) to include a contemporary example of an ethical breach and to reflect Canadian ethical guidelines and privacy laws, additional information regarding online data collection in Chapter 9 (Survey Research), corrections of errors in the text and formulae, spelling changes from US to Canadian conventions, the addition of a cover page, and other necessary formatting adjustments.

The second adaptation incorporated the second Canadian edition (published in 2013) by Rajiv S. Jhangiani (Kwantlen Polytechnic University) and I-Chant A. Chiang (Quest University Canada), licensed under a Creative Commons Attribution-NonCommercial-ShareAlike 4.0 International License. Major revisions included numerous new examples and links to outside resources throughout the book, references to replicability and open science (Chapters 1 and 13), and additions to discussions of validity (Chapters 5 & 6), the addition of a glossary of key terms, and numerous illustrations, descriptions, and exercises throughout.

The second American edition constituted a major revision for the first Canadian edition was the substitution of the original ethics chapter (Chapter 3) from the first American edition, and the reversion of Canadian spelling conventions to American spelling conventions.

Cover photo: “Great Wave off Kanagawa” after Katsushika Hokusai (葛飾北斎) is public domain.

The third U.S. edition was authored by Carrie Cuttler (Washington State University) in 2017 and is licensed under a Creative Commons Attribution-NonCommercial-ShareAlike 4.0 International License. Revisions in the current edition include general reorganization, language revision, spelling, formatting, additional video links, and examples throughout. More specifically, the overall model section was moved from Chapter 1 to Chapter 2, new sections were added to Chapter 1 on methods of knowing and goals of science, and a link on the replication crisis in psychology was added to Chapter 1. Chapter 2 was also reorganized by moving the section on reviewing the research literature to earlier in the chapter and taking sections from Chapter 4 (on theories and hypotheses), moving them to Chapter 2, and cutting the remainder of Chapter 4. Sections of Chapter 2 on correlation were also moved to Chapter 6. New sections on characteristics of good research questions, an overview of experimental vs. non-experimental research, a description of field vs. lab studies, and making conclusions were also added to Chapter 2. Chapter 3 was expanded by adding a definition of anonymity, elaborating on the Belmont Report (the principles of respect for persons and beneficence were added), and adding a link to a clip dispelling the myth that vaccines cause autism. Sections from Chapter 4 (on defining theories and hypotheses) were moved to Chapter 2 and the remainder of the previous Chapter 4 (on phenomenon, theories, and hypotheses) was cut. Chapter 5 was reorganized by moving the sections on four types of validity, manipulation checks, and placebo effects to later in the chapter. Descriptions of single factor two-level designs, single factor multi-level designs, matched-groups designs, order effects, and random counterbalancing were added to Chapter 5 and the concept of statistical validity was expanded upon. Chapter 6 was also reorganized by moving sections describing correlation coefficients from Chapters 2 and 12 to Chapter 6. The section of the book on complex correlation was also moved to Chapter 6 and the section on quasi-experiments was moved from Chapter 6 to its own chapter (Chapter 8). The categories of non-experimental research described in Chapter 6 were change to cross-sectional, correlational, and observational research. Chapter 6 was further expanded to describe cross-sectional studies, partial correlation, simple regression, the use of regression to make predictions, case studies, participant observation, disguised and undisguised observation, and structured observation. The terms independent variable and dependent variable as used in the context of regression were changed to predictor variable and outcome/criterion variable respectively. A distinction between proportionate stratified sampling and disproportionate stratified sampling was added to Chapter 7. The section on quasi-experimental designs was moved to its own chapter (Chapter 8) and was elaborated upon to include instrumentation and testing as threats to internal validity of one-group pretest-posttest designs, and to include sections describing the one-group posttest only design, pretest-posttest nonequivalent groups design, interrupted time-series with nonequivalent groups design, pretest-posttest design with switching replication, and switching replication with treatment removal designs. The section of Chapter 9 on factorial designs was split into two sections and the remainder of the chapter was moved or cut. Further, examples of everyday interactions were added and a description of simple effects was added to Chapter 9. The section on case studies that appeared in Chapter 10 was edited and moved to Chapter 6. Further, labels were added to multiple-baseline across behaviors, settings, and participants designs, and a concluding paragraph on converging evidence was added to Chapter 10. Only minor edits were made to the remaining chapters (Chapters 11, 12, and 13).

Year of Publication: 2017

Word Count: 119055

(Note: This resource's metadata has been created automatically by reformatting and/or combining the information that the author initially provided as part of a bulk import process.)
Subject:
Applied Science
Information Science
Psychology
Social Science
Material Type:
Textbook
Date Added:
08/21/2017
Research Methods in Psychology
Conditional Remix & Share Permitted
CC BY-NC-SA
Rating
0.0 stars

2nd Canadian Edition

Long Description:
This textbook is an adaptation of one written by Paul C. Price (California State University, Fresno) and adapted by The Saylor Foundation under a Creative Commons Attribution-NonCommercial-ShareAlike 3.0 License without attribution as requested by the work’s original creator or licensee. The original text is available here: http://www.saylor.org/site/textbooks/

The first Canadian edition (published in 2013) was authored by Rajiv S. Jhangiani (Kwantlen Polytechnic University) and was licensed under a Creative Commons Attribution-NonCommercial-ShareAlike 3.0 License. Revisions included the addition of a table of contents, changes to Chapter 3 (Research Ethics) to include a contemporary example of an ethical breach and to reflect Canadian ethical guidelines and privacy laws, additional information regarding online data collection in Chapter 9 (Survey Research), corrections of errors in the text and formulae, spelling changes from US to Canadian conventions, the addition of a cover page, and other necessary formatting adjustments.

The present adaptation constitutes the second Canadian edition and was co-authored by Rajiv S. Jhangiani (Kwantlen Polytechnic University) and I-Chant A. Chiang (Quest University Canada) and is licensed under a Creative Commons Attribution-NonCommercial-ShareAlike 4.0 International License. Revisions include the following: Chapter 1: Added a description of the “Many Labs Replication Project,” added a reference to the Neurobonkers website, and embedded videos about open access publishing, driver distraction, two types of empirical studies, and the use of evidence to evaluate the world around us. Chapter 2: Updated the exemplar study in the chapter overview, added relevant examples and descriptions of contemporary studies, provided a link to an interactive visualization for correlations, added a description of double-blind peer review, added a figure to illustrate a spurious correlation, and embedded videos about how to develop a good research topic, searching the PsycINFO database, using Google Scholar, and how to read an academic paper. Chapter 3: Added in LaCour ethical violation. Revised chapter headings and order to reflect TCPS-2 moral principles. Chapter 4: Added in difference between laws and effects and theoretical framework. Chapter 5: Added fuller descriptions of the levels of measurement, added a table to summarize the levels of measurement, added a fuller description of the MMPI, removed the discussion of the IAT, and added descriptions of concurrent, predictive, and convergent validity. Chapter 6: Added in construct validity, statistical validity, mundane realism, psychological realism, Latin Square Design. Updated references. Chapter 7: Added in mixed-design studies and fuller discussion of qualitative-quantitative debate. Chapter 8: Added an exercise to sketch the 8 possible results of a 2 x 2 factorial experiment. Chapter 9: Added information about Canadian Election Studies, more references, specific guidelines about order and open-ended questions, and rating scale. Updated online survey creation sites. Chapter 10: No significant changes were made. Chapter 11: Updated examples and links to online resources. Chapter 12: No significant changes were made. Chapter 13: Added discussion of p-curve and BASP announcement about banning p-values. Added a section that introduces the “replicability crisis” in psychology, along with discussions of questionable research practices, best practices in research design and data management, and the emergence of open science practices and Transparency and Openness Promotion guidelines. Glossary of key terms: Added.

In addition, throughout the textbook, we revised the language to be more precise and to improve flow, added links to other chapters, added images, updated hyperlinks, corrected spelling and formatting errors, and changed references to reflect the contemporary Canadian context.

Cover photo: “magic eye // I have been tagged” by Fabian is licensed under CC BY-NC-ND 2.0

Year of Publication: 2015

Word Count: 114480

(Note: This resource's metadata has been created automatically as part of a bulk import process by reformatting and/or combining the information that the author initially provided. As a result, there may be errors in formatting.)

Subject:
Psychology
Social Science
Date Added:
10/13/2015
Resources: Sizes, Scales and Specialization: Using Relative Proportions and Scientific Notation to Highlight the Diversity of Cell Types
Conditional Remix & Share Permitted
CC BY-SA
Rating
0.0 stars

Size, Scales, and Specialization was developed as part of an effort by the Quantitative Biology at Community Colleges group to provide materials that incorporate mathematical concepts into biology courses. The activity uses published estimates of cell type numbers in the human body along with size, density and weight as a lens to have students calculate ratios, explore exponents, and better understand how the various cell types contribute to an average human's total weight and size. The activity is applicable for majors and non-majors biology courses, and maps to Chapter 4 of the OpenStax Biology 2e textbook. This activity could also be used in a mathematics course as a biologically relevant example.

The activity contains a pre-assessment to gauge student understanding of the material and provides an opportunity for students to predict the number of various cell types, as well as the mass of various cell types, in the human body. This prediction activity is followed with a guided approach to calculating these values. After guiding the students in this activity, students will then have a chance to practice the activity on a new set of cell data provided.

After completing this module students should be able to:

- Compare and contrast the structure and function of different cell types.
-- List the largest and the smallest cells in the body based on number.
-- List the largest and the smallest cells in the body based on mass.
- Describe the advantages of specialization in eukaryotic cells.
-- Give examples of how specialization in cell types affects cell size (volume) and shape.
- Perform measurements and conversions using the metric system.
-- Measure the scale of cell size variation in the human body
-- Calculate the relative proportions of cell types in the human body by mass and frequency

Subject:
Algebra
Biology
Life Science
Mathematics
Material Type:
Activity/Lab
Data Set
Homework/Assignment
Author:
Heather Seitz
Jillian Marie Miller
Joseph Esquibel
Date Added:
04/23/2021
Responding to Climate Change
Read the Fine Print
Rating
0.0 stars

This is the ninth and final lesson in a series of lessons about climate change. This lesson focuses on the various activities that humans can do to mitigate the effects of climate change. This includes information on current and predicted CO2 emission scenarios across the globe, alternative energy sources, and how people are currently responding to climate change. Importantly, this lesson is motivating in showing students that they can make a difference.

Subject:
Applied Science
Atmospheric Science
Career and Technical Education
Environmental Science
Environmental Studies
Physical Science
Material Type:
Activity/Lab
Provider:
CLEAN: Climate Literacy and Energy Awareness Network
Provider Set:
CLEAN: Climate Literacy and Energy Awareness Network
Author:
King's Centre for Visualization in Science
Date Added:
09/24/2018