Updating search results...

Search Resources

1054 Results

View
Selected filters:
Prognostic and diagnostic biomarker panels for meniscus allograft transplantation in dogs
Unrestricted Use
CC BY
Rating
0.0 stars

This resource is a video abstract of a research paper created by Research Square on behalf of its authors. It provides a synopsis that's easy to understand, and can be used to introduce the topics it covers to students, researchers, and the general public. The video's transcript is also provided in full, with a portion provided below for preview:

"A new preclinical animal model study has identified biomarker panels that might be useful predictors and indicators of outcomes after meniscus allograft transplantation, or MAT. These biomarkers may enable real-time assessment of graft survival after surgery. The findings are published in The American Journal of Sports Medicine. Meniscal tears and degeneration—or partial meniscectomy surgeries intended to alleviate these issues—can cause meniscal deficiency. In meniscal deficiency, lack of a complete meniscus increases stress to the knee joint, contributing to pain, dysfunction, and osteoarthritis. Restoring the meniscus through strategies like MAT can prevent these issues. However, there are currently no methods for predicting and evaluating MAT graft success or failure in real time. To help develop such a method, researchers searched for biomarkers of MAT outcomes in a dog model. First, they induced meniscal deficiency in dogs through arthroscopic medial meniscal release surgery..."

The rest of the transcript, along with a link to the research itself, is available on the resource itself.

Subject:
Applied Science
Health, Medicine and Nursing
Material Type:
Diagram/Illustration
Reading
Provider:
Research Square
Provider Set:
Video Bytes
Date Added:
01/31/2023
Project Organization and Management for Genomics
Unrestricted Use
CC BY
Rating
0.0 stars

Data Carpentry Genomics workshop lesson to learn how to structure your metadata, organize and document your genomics data and bioinformatics workflow, and access data on the NCBI sequence read archive (SRA) database. Good data organization is the foundation of any research project. It not only sets you up well for an analysis, but it also makes it easier to come back to the project later and share with collaborators, including your most important collaborator - future you. Organizing a project that includes sequencing involves many components. There’s the experimental setup and conditions metadata, measurements of experimental parameters, sequencing preparation and sample information, the sequences themselves and the files and workflow of any bioinformatics analysis. So much of the information of a sequencing project is digital, and we need to keep track of our digital records in the same way we have a lab notebook and sample freezer. In this lesson, we’ll go through the project organization and documentation that will make an efficient bioinformatics workflow possible. Not only will this make you a more effective bioinformatics researcher, it also prepares your data and project for publication, as grant agencies and publishers increasingly require this information. In this lesson, we’ll be using data from a study of experimental evolution using E. coli. More information about this dataset is available here. In this study there are several types of files: Spreadsheet data from the experiment that tracks the strains and their phenotype over time Spreadsheet data with information on the samples that were sequenced - the names of the samples, how they were prepared and the sequencing conditions The sequence data Throughout the analysis, we’ll also generate files from the steps in the bioinformatics pipeline and documentation on the tools and parameters that we used. In this lesson you will learn: How to structure your metadata, tabular data and information about the experiment. The metadata is the information about the experiment and the samples you’re sequencing. How to prepare for, understand, organize and store the sequencing data that comes back from the sequencing center How to access and download publicly available data that may need to be used in your bioinformatics analysis The concepts of organizing the files and documenting the workflow of your bioinformatics analysis

Subject:
Business and Communication
Genetics
Life Science
Management
Material Type:
Module
Provider:
The Carpentries
Author:
Amanda Charbonneau
Bérénice Batut
Daniel O. S. Ouso
Deborah Paul
Erin Alison Becker
François Michonneau
Jason Williams
Juan A. Ugalde
Kevin Weitemier
Laura Williams
Paula Andrea Martinez
Peter R. Hoyt
Rayna Michelle Harris
Taylor Reiter
Toby Hodges
Tracy Teal
Date Added:
08/07/2020
Protecting Wildlife in a Changing Climate
Read the Fine Print
Rating
0.0 stars

This video presents predictions and solutions for range shifts (wildlife corridors) by an iconic species of North American wilderness: the wolverine.

Subject:
Career and Technical Education
Ecology
Environmental Studies
Life Science
Physical Science
Provider:
CLEAN: Climate Literacy and Energy Awareness Network
Provider Set:
CLEAN: Climate Literacy and Energy Awareness Network
Author:
American Museum of Natural History
Date Added:
09/24/2018
Protein classification: An introduction to EMBL-EBI resources
Unrestricted Use
CC BY
Rating
0.0 stars

This course will provide an introduction to protein classification and basic concepts, such as proteins families, domains and sequence features.

By the end of the course you will be able to:
Describe the importance of classifying proteins
Explain how protein families, domains and sequence features can be defined, and how these can be used to classify proteins
Describe the different predictive methods you can use to help classify proteins: patterns, profiles, fingerprints and hidden Markov models (HMMs)
List which resources for classifying proteins according to family, domain and sequence features are available at the EMBL-EBI

Subject:
Applied Science
Life Science
Material Type:
Full Course
Provider:
EMBL-EBI
Date Added:
07/01/2020
Prying open AI’s black box reveals insights into why cancers recur
Unrestricted Use
CC BY
Rating
0.0 stars

This resource is a video abstract of a research paper created by Research Square on behalf of its authors. It provides a synopsis that's easy to understand, and can be used to introduce the topics it covers to students, researchers, and the general public. The video's transcript is also provided in full, with a portion provided below for preview:

"Artificial intelligence is making rapid advances in medicine. Already, there are machine learning algorithms that can outperform doctors in some medical fields. There’s only one fairly big problem: experts aren’t quite sure how these algorithms work. While designers know full well what goes into the A-I systems they build and what comes out, the learning part in between is often too complex to comprehend. To their users, machine learning algorithms are effectively black boxes. Now, researchers from the RIKEN Center for Advanced Intelligence Project in Japan are lifting the lid. They’ve developed a deep-learning system that can outperform human experts in predicting whether prostate cancer will reoccur within one year. More importantly, the deep learning system they developed can acquire human-understandable features from unannotated pathology images to offer up critical clues that could help humans make better diagnoses themselves..."

The rest of the transcript, along with a link to the research itself, is available on the resource itself.

Subject:
Applied Science
Health, Medicine and Nursing
Material Type:
Diagram/Illustration
Reading
Provider:
Research Square
Provider Set:
Video Bytes
Date Added:
10/23/2020
Public Data Archiving in Ecology and Evolution: How Well Are We Doing?
Unrestricted Use
CC BY
Rating
0.0 stars

Policies that mandate public data archiving (PDA) successfully increase accessibility to data underlying scientific publications. However, is the data quality sufficient to allow reuse and reanalysis? We surveyed 100 datasets associated with nonmolecular studies in journals that commonly publish ecological and evolutionary research and have a strong PDA policy. Out of these datasets, 56% were incomplete, and 64% were archived in a way that partially or entirely prevented reuse. We suggest that cultural shifts facilitating clearer benefits to authors are necessary to achieve high-quality PDA and highlight key guidelines to help authors increase their data’s reuse potential and compliance with journal data policies.

Subject:
Biology
Life Science
Material Type:
Reading
Provider:
PLOS Biology
Author:
Dominique G. Roche
Loeske E. B. Kruuk
Robert Lanfear
Sandra A. Binning
Date Added:
08/07/2020
Putting It All Together (Water Cycle, Deforestation, and Climate Change #4)
Conditional Remix & Share Permitted
CC BY-NC
Rating
0.0 stars

SYNOPSIS: In this lesson, students learn about extreme weather, create an infographic, and educate others on the knowledge gained from this unit.

SCIENTIST NOTES: This lesson allows students to understand the difference between weather and climate, the important variables that cause changes in weather, how weather and climate are predicted, the impact of weather extremes on the climate, and how human activities have accelerated wildfires, disrupted the water cycle, and caused other erratic weather disturbances in their communities. They would be able to explore which weather events are frequent and the overall combined impacts. All materials were rigorously reviewed, and this lesson has passed our science credibility process.

POSITIVES:
-Students participate in multiple interactive and hands-on learning activities to engage in kinesthetic, auditory, and visual learning.
-Students have an opportunity to share their growth and knowledge throughout the unit with other students and community members.

ADDITIONAL PREREQUISITES:
-This is lesson 4 of 4 in our 6th-8th grade Water Cycle, Deforestation, and Climate Change unit.
-Teachers need to determine how to choose the best course of action for sharing student learning. Options include the following:
-Class vote
-Teacher predetermines based on their best judgment
-Student panel is created
-Different groups choose different courses of action

DIFFERENTIATION:
-Students may use the Emotions Board for vocabulary support as they watch the videos in the Inquire section
-At the end of the unit, a classroom gallery walk is recommended.
-Some ideas for extensions at the end of the unit include:
-Inviting other classes in for a gallery walk
-Hosting a community night where community members can be educated on what students have learned in the unit
-Mailing student materials to different leaders in the community, particularly leaders that are in charge of the local water sources

Subject:
Geoscience
Physical Science
Space Science
Material Type:
Lesson Plan
Provider:
SubjectToClimate
Author:
Mallory Swafford
Date Added:
06/29/2023
Putting Robots to Work with Force & Friction
Read the Fine Print
Educational Use
Rating
0.0 stars

Students learn about the concept of pushing, as well as the relationship between force and mass. Students practice measurement skills using pan scales and rulers to make predictions about mass and distance. A LEGO MINDSTORMS(TM) NXT robot is used to test their hypotheses. By the end of the activity, students have a better understanding of robotics, mass and friction and the concept of predicting.

Subject:
Applied Science
Engineering
Physical Science
Physics
Material Type:
Activity/Lab
Provider:
TeachEngineering
Provider Set:
TeachEngineering
Author:
Donna Johnson
Janet Yowell
Joseph Frezzo
Raymond Le Grand
Robyn Tommaselli
Tanjia Chowdhury
Date Added:
09/18/2014
Pythagorean Spiral Project
Unrestricted Use
CC BY
Rating
0.0 stars

This is a cross curricular art project for 8th grade math students. Students are first introduced to what the Wheel of Theodorus is, ponder where they see it in the world around them and then instructed on how to create their own. When they have finished constructing their Wheel of Theodorus they are asked to creatively and colorfully turn it "into" something. Examples are given. After they Wheel of Theodorus is complete, students are then asked to measure all the sides lengths of the triangles in the wheel. They should quickly see that they can use the Pythagorean Theorem to do this and that it follows a predictable pattern. No ruler will be required for this part of the project! 

Subject:
Geometry
Mathematics
Material Type:
Activity/Lab
Author:
Tracie Williams-Burns
Date Added:
03/20/2023
Pythagorean Spiral Project
Unrestricted Use
CC BY
Rating
0.0 stars

This is a cross curricular art project for 8th grade math students. Students are first introduced to what the Wheel of Theodorus is, ponder where they see it in the world around them and then instructed on how to create their own. When they have finished constructing their Wheel of Theodorus they are asked to creatively and colorfully turn it "into" something. Examples are given. After they Wheel of Theodorus is complete, students are then asked to measure all the sides lengths of the triangles in the wheel. They should quickly see that they can use the Pythagorean Theorem to do this and that it follows a predictable pattern. No ruler will be required for this part of the project! 

Subject:
Geometry
Mathematics
Material Type:
Activity/Lab
Homework/Assignment
Author:
Jennifer Chandler
Sara Scholes
Date Added:
03/26/2020
Quantifying Antibodies Directed against the SARS-CoV-2 Spike Protein S1 Subunit
Unrestricted Use
CC BY
Rating
0.0 stars

This resource is a video abstract of a research paper created by Research Square on behalf of its authors. It provides a synopsis that's easy to understand, and can be used to introduce the topics it covers to students, researchers, and the general public. The video's transcript is also provided in full, with a portion provided below for preview:

"With the COVID-19 pandemic causing a global health crisis, accurate diagnosis is critical. Diagnosing acute disease relies on RT-PCR tests measuring the presence of SARS-CoV-2 in the sampled material but in patients with suspected COVID-19 with a negative RT-PCR result, measuring anti-viral antibodies can help clinicians identify infected individuals. Antibody testing can also determine if someone was previously infected and help to measure the prevalence of the virus in a community. A new study characterizes an assay measuring total antibodies – combined IgA, IgM, and IgG isotypes – against SARS-CoV-2. The assay, ECLIA, specifically measures antibodies against the S1 subunit of the viral spike, which carries the virus’s receptor binding domain. Researchers in Liechtenstein evaluated ECLIA in a population with 125 cases of confirmed SARS-CoV-2 infection and 1159 individuals without evidence of COVID-19. The results showed a test sensitivity of 97.6%, while the specificity was 99.8%..."

The rest of the transcript, along with a link to the research itself, is available on the resource itself.

Subject:
Applied Science
Health, Medicine and Nursing
Material Type:
Diagram/Illustration
Reading
Provider:
Research Square
Provider Set:
Video Bytes
Date Added:
02/25/2021
Quantifying Refraction
Read the Fine Print
Educational Use
Rating
0.0 stars

Students learn the relevant equations for refraction (index of refraction, Snell's law) and how to use them to predict the behavior of light waves in specified scenarios. After a brief review of the concept of refraction (as learned in the previous lesson), the equations along with their units and variable definitions, are introduced. Student groups work through a few example conceptual and mathematical problems and receive feedback on their work. Then students conduct the associated activity during which they practice using the equations in a problem set, examine data from a porous film like those used in biosensors, and apply the equations they learned to a hypothetical scenario involving biosensors.

Subject:
Applied Science
Engineering
Physical Science
Physics
Material Type:
Lesson Plan
Provider:
TeachEngineering
Provider Set:
TeachEngineering
Author:
Caleb Swartz
Date Added:
09/18/2014
Quantitative Genetics for Plant Breeding
Conditional Remix & Share Permitted
CC BY-NC
Rating
0.0 stars

This open textbook is intended to expose students to the application of quantitative genetic models to plant breeding populations. Specific topics include conducting and interpreting multi-environment trials, resource allocation using engineering principles, genetic modeling of quantitative traits, simulation modeling, variance, covariance and heritability, prediction, selection, and genetic gain.

Subject:
Agriculture
Career and Technical Education
Forestry and Agriculture
Genetics
Life Science
Material Type:
Textbook
Provider:
Iowa State University
Author:
Anthony Assibi Mahama
Katherine Espinosa
Kendall Lamkey
Mark Newell
Walter Suza
William Beavis
Date Added:
10/18/2023
Quantitative systems pharmacology model of a masked, tumor-activated antibody
Unrestricted Use
CC BY
Rating
0.0 stars

This resource is a video abstract of a research paper created by Research Square on behalf of its authors. It provides a synopsis that's easy to understand, and can be used to introduce the topics it covers to students, researchers, and the general public. The video's transcript is also provided in full, with a portion provided below for preview:

"herapeutic monoclonal antibodies bind proteins on tumors, which can enable the killing of cancer cells. However, there can be collateral damage to healthy tissues that also express those proteins. At CytomX , researchers are exploring the use of a new class of antibodies called Probody™ therapeutics. Masks attached to the ends of a Probody therapeutic can “blindfold” the antibody and reduce its binding to healthy tissues. However, when the antibody encounters a tumor, proteases —enzymes in the tumor microenvironment—can remove these masks to activate the antibody. In this way, Probody therapeutics are designed to maximize anti-cancer activity while minimizing harm to healthy tissue. In a new study, researchers used computer modeling to predict how Probody therapeutics can be tuned to achieve this effect. This model, comprising thousands of equations, estimates the amount of both masked and unmasked (or activated) forms of the antibody in the tumor and in the rest of the body after dosing..."

The rest of the transcript, along with a link to the research itself, is available on the resource itself.

Subject:
Applied Science
Health, Medicine and Nursing
Material Type:
Diagram/Illustration
Reading
Provider:
Research Square
Provider Set:
Video Bytes
Date Added:
11/12/2019
Questionable and Open Research Practices in Education Research
Unrestricted Use
CC BY
Rating
0.0 stars

Discussions of how to improve research quality are predominant in a number of fields, including education. But how prevalent are the use of problematic practices and the improved practices meant to counter them? This baseline information will be a critical data source as education researchers seek to improve our research practices. In this preregistered study, we replicated and extended previous studies from other fields by asking education researchers about 10 questionable research practices and 5 open research practices. We asked them to estimate the prevalence of the practices in the field, self-report their own use of such practices, and estimate the appropriateness of these behaviors in education research. We made predictions under four umbrella categories: comparison to psychology, geographic location, career stage, and quantitative orientation. Broadly, our results suggest that both questionable and open research practices are part of the typical research practices of many educational researchers. Preregistration, code, and data can be found at https://osf.io/83mwk/.

Subject:
Education
Material Type:
Reading
Author:
Bryan G. Cook
Jaret Hodges
Jonathan Plucker
Matthew C. Makel
Date Added:
08/07/2020
RStudio Cheatsheets
Unrestricted Use
CC BY
Rating
0.0 stars

RStudio Cheatsheets

The cheatsheets below make it easy to use some of our favorite packages. Cheatsheets include the following topics:

Python with R and Reticulate Cheatsheet
The reticulate package provides a comprehensive set of tools for interoperability between Python and R. With reticulate, you can call Python from R in a variety of ways including importing Python modules into R scripts, writing R Markdown Python chunks, sourcing Python scripts, and using Python interactively within the RStudio IDE. This cheatsheet will remind you how.

Factors with forcats Cheatsheet
Factors are R’s data structure for categorical data. The forcats package makes it easy to work with factors. This cheatsheet reminds you how to make factors, reorder their levels, recode their values, and more.

Tidy Evaluation with rlang Cheatsheet
Tidy Evaluation (Tidy Eval) is a framework for doing non-standard evaluation in R that makes it easier to program with tidyverse functions. Non-standard evaluation, better thought of as “delayed evaluation,” lets you capture a user’s R code to run later in a new environment or against a new data frame. The tidy evaluation framework is implemented by the rlang package and used by functions throughout the tidyverse.

Deep Learning with Keras Cheatsheet
Keras is a high-level neural networks API developed with a focus on enabling fast experimentation. Keras supports both convolution based networks and recurrent networks (as well as combinations of the two), runs seamlessly on both CPU and GPU devices, and is capable of running on top of multiple back-ends including TensorFlow, CNTK, and Theano.

Dates and Times Cheatsheet
Lubridate makes it easier to work with dates and times in R. This lubridate cheatsheet covers how to round dates, work with time zones, extract elements of a date or time, parse dates into R and more. The back of the cheatsheet describes lubridate’s three timespan classes: periods, durations, and intervals; and explains how to do math with date-times.

Work with Strings Cheatsheet
The stringr package provides an easy to use toolkit for working with strings, i.e. character data, in R. This cheatsheet guides you through stringr’s functions for manipulating strings. The back page provides a concise reference to regular expresssions, a mini-language for describing, finding, and matching patterns in strings.

Apply Functions Cheatsheet
The purrr package makes it easy to work with lists and functions. This cheatsheet will remind you how to manipulate lists with purrr as well as how to apply functions iteratively to each element of a list or vector. The back of the cheatsheet explains how to work with list-columns. With list columns, you can use a simple data frame to organize any collection of objects in R.

Data Import Cheatsheet
The Data Import cheatsheet reminds you how to read in flat files with http://readr.tidyverse.org/, work with the results as tibbles, and reshape messy data with tidyr. Use tidyr to reshape your tables into tidy data, the data format that works the most seamlessly with R and the tidyverse.

Data Transformation Cheatsheet
dplyr provides a grammar for manipulating tables in R. This cheatsheet will guide you through the grammar, reminding you how to select, filter, arrange, mutate, summarise, group, and join data frames and tibbles.

Sparklyr Cheatsheet
Sparklyr provides an R interface to Apache Spark, a fast and general engine for processing Big Data. With sparklyr, you can connect to a local or remote Spark session, use dplyr to manipulate data in Spark, and run Spark’s built in machine learning algorithms.

R Markdown Cheatsheet
R Markdown is an authoring format that makes it easy to write reusable reports with R. You combine your R code with narration written in markdown (an easy-to-write plain text format) and then export the results as an html, pdf, or Word file. You can even use R Markdown to build interactive documents and slideshows.

RStudio IDE Cheatsheet
The RStudio IDE is the most popular integrated development environment for R. Do you want to write, run, and debug your own R code? Work collaboratively on R projects with version control? Build packages or create documents and apps? No matter what you do with R, the RStudio IDE can help you do it faster. This cheatsheet will guide you through the most useful features of the IDE, as well as the long list of keyboard shortcuts built into the RStudio IDE.

Shiny Cheatsheet
If you’re ready to build interactive web apps with R, say hello to Shiny. This cheatsheet provides a tour of the Shiny package and explains how to build and customize an interactive app. Be sure to follow the links on the sheet for even more information.

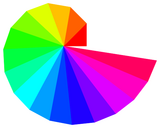
Data Visualization Cheatsheet
The ggplot2 package lets you make beautiful and customizable plots of your data. It implements the grammar of graphics, an easy to use system for building plots. See docs.ggplot2.org for detailed examples.

Package Development Cheatsheet
The devtools package makes it easy to build your own R packages, and packages make it easy to share your R code. Supplement this cheatsheet with r-pkgs.had.co.nz, Hadley’s book on package development.

Subject:
Applied Science
Life Science
Physical Science
Social Science
Material Type:
Student Guide
Provider:
RStudio
Author:
RStudio
Date Added:
08/07/2020
Radiographic diagnosis proves powerful in predicting type of acetabular chondral injury
Unrestricted Use
CC BY
Rating
0.0 stars

This resource is a video abstract of a research paper created by Research Square on behalf of its authors. It provides a synopsis that's easy to understand, and can be used to introduce the topics it covers to students, researchers, and the general public. The video's transcript is also provided in full, with a portion provided below for preview:

"Abnormal wearing of the hip joint, or femoroacetabular impingement, and dysplasia represent the two most common causes of secondary osteoarthritis of the hip joint. These pathologies are known to produce distinctive chondral flaps visible during hip arthroscopy. But the destructive mechanics behind each diagnosis differ significantly. That makes treatment planning especially difficult for patients who show signs of both impingement and dysplasia. To provide some clarity, researchers examined 95 patients demonstrating acetabular chondral flaps during arthroscopy, with the goal of correlating those findings with radiographic data. The patterns that emerged could help surgeons deliver the best possible care for patients with mixed hip pathologies. Patients exhibited one of two types of chondral flaps upon examination: “inside-out” or “outside-in”..."

The rest of the transcript, along with a link to the research itself, is available on the resource itself.

Subject:
Applied Science
Health, Medicine and Nursing
Material Type:
Diagram/Illustration
Reading
Provider:
Research Square
Provider Set:
Video Bytes
Date Added:
10/24/2019