In this lesson, students begin working with the data that they have …
In this lesson, students begin working with the data that they have been collecting since the first lesson of the chapter in the class "data tracker." They are introduced to the first step in analyzing data: cleaning the data. Students will follow a guide in Code Studio, which demonstrates the common techniques of filtering and sorting data to familiarize themselves with its contents. Then they will correct errors they find in the data by either hand-correcting invalid values or deleting them. Finally they will categorize any free-text columns that were collected to prepare them for analysis. This lesson introduces many new skills with spreadsheets and reveals the sometimes subjective nature of data analysis.
Students will examine how technology is changing or eliminated careers that currently …
Students will examine how technology is changing or eliminated careers that currently exist. Students will draw conclusions and develop hypotheses about these current careers and the changes that could possibly occur based on technology.
Maps capture the power of place. A well-designed map can stoke our …
Maps capture the power of place. A well-designed map can stoke our imagination, helping us to understand how a place looks or feels. Maps serve two roles. First, maps facilitate visual communication where knowns are presented to map readers. Second, maps permit visual thinking where insights into patterns and trends in spatial data are explored. In GEOG 486, Cartography & Visualization, you will learn and apply cartographic theory creating appropriately designed maps. You will learn how to associate the visual variables to symbolize types of spatial data. This process creates an appropriate visual hierarchy that conveys an informational hierarchy about the underlying message. Thus, techniques in map design will be applied to produce, evaluate, and critique reference and thematic maps.
Teachers will engage students in a discussion about what the Census Bureau …
Teachers will engage students in a discussion about what the Census Bureau does and what types of information it collects. Then students will read and annotate informational texts from the Census Bureau and work with a partner to answer questions about the texts. Students will also analyze an infographic of people with different professions to determine how each of those people might use the data gathered by the Census Bureau; students will be asked to use evidence from the infographic text to support their answers. Students will then complete a wireframe (similar to a graphic organizer) for an online resource about how census data can help their own community.
Students will analyze a variety of county-level census data, including on employment, …
Students will analyze a variety of county-level census data, including on employment, technology, and transportation, in histograms to compare and contrast the shapes of their distributions and to interpret measures of center and spread in context.
This activity provides students with the opportunity to gather data from a …
This activity provides students with the opportunity to gather data from a controlled experiment setting, interpret their findings and use the data to draw conclusions to solve a mystery.
This tombstone weathering lab is designed to provide students with tangible understanding …
This tombstone weathering lab is designed to provide students with tangible understanding of chemical weathering and weathering rates. To prepare for this lab, students will have learned in previous labs to identify common minerals and rocks and will have attended lectures about the process of chemical weathering. During the first part of the lab we travel to the city cemetery to collect data on the age and extent of chemical weathering of tombstones that are made of limestone and igneous rocks. After collecting data for ~1 hour, we return to the computer lab where students use Microsoft Excel to analyze and interpret their data. Their task is to calculate a chemical weathering rate for limestone for our region and compare that rate to those from other regions. This activity gives students experience in the process of scientific inquiry: data collection, data analysis and data interpretation. Students develop Microsoft Excel skills: writing formulas, producing charts, understanding trendlines and R2 values.
(Note: this resource was added to OER Commons as part of a batch upload of over 2,200 records. If you notice an issue with the quality of the metadata, please let us know by using the 'report' button and we will flag it for consideration.)
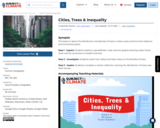
SYNOPSIS: This lesson is about the distribution and density of trees in …
SYNOPSIS: This lesson is about the distribution and density of trees in urban areas and how that relates to environmental justice.
SCIENTIST NOTES: This lesson uses data from peer-reviewed research that breaks down the forest cover in cities as it correlates to income. The evidence is clear and convincing that more affluent neighborhoods have more tree cover, which has a documented benefit on the residents. All external links are scientifically sound, and this lesson has pass our science quality assessment.
POSITIVES: -This is an engaging lesson because it is so personal. Students will think about tree cover where they live and how that relates to demographic data. -Students will practice their data analysis skills.
ADDITIONAL PREREQUISITES: -It is necessary to share the Student Slideshow with your students and give them editing access before beginning the lesson. All students will be writing in the same slideshow. -The videos list the benefits of trees pretty quickly. It might be hard for students to type fast enough to keep up. You could play the videos at 0.9 speed or replay parts of the videos as necessary. -The following is a list of benefits of trees. Students will create a similar list while they are watching the two videos outlining the benefits of trees.
-Reduce nearby outside temperatures -Reduce amount of energy used for heating and cooling buildings -Absorb carbon dioxide, thus mitigating climate change -Filter urban pollutants and fine particulates -Provide habitat, food, and protection to plants and animals -Provide food for people -Increase biodiversity -Provide wood that can be used at the end of a tree’s life -Improve physical and mental health of people -Increase property values -Create oxygen -Provide shade for people and animals -Control stormwater runoff, protecting water quality and reducing the need for water treatment -Protect against mudslides -Help prevent floods -Improve air quality -Increase attention spans and decrease stress levels in people -Improve health outcomes in hospital patients
DIFFERENTIATION: -Teachers can use the glossary at the end of the slideshow at any point throughout the lesson to help students understand vocabulary.
-The spreadsheet and the graph on slide 11 might be tricky. Encourage your students to turn and talk to one another for help.
-Many students will not have a good understanding of Celsius. Easy reminder: Multiply the temperature in Celsius by 1.8 to get degrees Fahrenheit. Example: 2.5°C x 1.8 = 4.5°F (The temperature difference between poorest and richest census blocks in Milwaukee, Wisconsin.)
Living in a big city like New York can be very challenging. …
Living in a big city like New York can be very challenging. City planning is an interdisciplinary enterprise where social scientists, humanists, psychologists, scientists, statisticians, citizens, politicians, etc. come together to offer solutions to improve quality of life in the city. To find such solutions, these people need clear and reliable (qualitative and quantitative) information about specific challenges that residents and visitors face For the variety of stakeholders in the city, many different things might be considered worthy of study, depending on their interests and needs regarding, e.g., employment, financial status, family size, healthcare, mobility, and education. For example, do you know whether your neighborhood issufficiently protected from a fire? What about other neighborhoods in the city? To what extent does a CUNY degree help a person gain employment in the City? In which ways do race or gender or sexual preference play a role in how people experience city life? Can these be quantified in dollar terms? Once you have identified a problem, write an essay that describes a question about city life that you believe is worthy of a statistical study.
This course introduces the concepts, techniques, and devices used to measure engineering …
This course introduces the concepts, techniques, and devices used to measure engineering properties of materials. There is an emphasis on measurement of load-deformation characteristics and failure modes of both natural and fabricated materials. Weekly experiments include data collection, data analysis, and interpretation and presentation of results.
This activity is a classroom and schoolyard investigation where students collect daily …
This activity is a classroom and schoolyard investigation where students collect daily temperature and precipitation readings, weather observations, and weekly phenology reports in a phenology binder and in nature journals. Students then analyze this data and compare to recorded values in the Weatherguide calendar.
Students will learn how species shift along environmental gradients (temperature, precipitation, and …
Students will learn how species shift along environmental gradients (temperature, precipitation, and vegetation) in response to climate change over the last 20,000 years, from the time of the Last Glacial Maximum through deglaciation and the Holocene. The activity involves making maps of species distribution using the Neotoma database. Students will develop skills in data analysis and interpretation over a two-to-four class arc.
(Note: this resource was added to OER Commons as part of a batch upload of over 2,200 records. If you notice an issue with the quality of the metadata, please let us know by using the 'report' button and we will flag it for consideration.)
As if they are environmental engineers, student pairs are challenged to use …
As if they are environmental engineers, student pairs are challenged to use Google Earth Pro (free) GIS software to view and examine past data on hurricanes and tornados in order to (hypothetically) advise their state government on how to proceed with its next-year budget—to answer the question: should we reduce funding for natural disaster relief? To do this, students learn about maps, geographic information systems (GIS) and the global positioning system (GPS), and how they are used to deepen the way maps are used to examine and analyze data. Then they put their knowledge to work by using the GIS software to explore historical severe storm (tornado, hurricane) data in depth. Student pairs confer with other teams, conduct Internet research on specific storms and conclude by presenting their recommendations to the class. Students gain practice and perspective on making evidence-based decisions. A slide presentation as well as a student worksheet with instructions and questions are provided.
This course provides an introductory survey of data science tools in healthcare. …
This course provides an introductory survey of data science tools in healthcare. It was created by members of MIT Critical Data, a global consortium consisting of healthcare practitioners, computer scientists, and engineers from academia, industry, and government, that seeks to place data and research at the front and center of healthcare operations. The most daunting global health issues right now are the result of interconnected crises. In this course, we highlight the importance of a multidisciplinary approach to health data science. It is intended for front-line clinicians and public health practitioners, as well as computer scientists, engineers, and social scientists, whose goal is to understand health and disease better using digital data captured in the process of care. What you'll learn:
Principles of data science as applied to health Analysis of electronic health records Artificial intelligence and machine learning in healthcare
This course is part of the Open Learning Library, which is free to use. You have the option to sign up and enroll in the course if you want to track your progress, or you can view and use all the materials without enrolling.
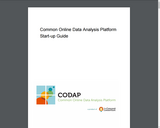
CODAP (Common Online Data Analysis Platform) is an easy to use data …
CODAP (Common Online Data Analysis Platform) is an easy to use data analysis environment that can be used in a wide variety of educational settings. CODAP is designed for grades 5 through 14, and aimed at teachers and curriculum developers. CODAP can be used across the curriculum to help students summarize, visualize, and interpret data, Conadvancing their skills to use data as evidence to support a claim.
Communicating With Data has a distinctive structure and content, combining fundamental quantitative …
Communicating With Data has a distinctive structure and content, combining fundamental quantitative techniques of using data to make informed management decisions with illustrations of how real decision makers, even highly trained professionals, fall prey to errors and biases in their understanding. We present the fundamental concepts underlying the quantitative techniques as a way of thinking, not just a way of calculating, in order to enhance decision-making skills. Rather than survey all of the techniques of management science, we stress those fundamental concepts and tools that we believe are most important for the practical analysis of management decisions, presenting the material as much as possible in the context of realistic business situations from a variety of settings. Exercises and examples drawn from marketing, finance, operations management, strategy, and other management functions.
Students groups create scientific research posters to professionally present the results of …
Students groups create scientific research posters to professionally present the results of their AQ-IQ research projects, which serves as a conclusion to the unit. (This activity is also suitable to be conducted independently from its unit—for students to make posters for any type of project they have completed.) First, students critically examine example posters to gain an understanding of what they contain and how they can be made most effective for viewers. Then they are prompted to analyze and interpret their data, including what statistics and plots to use in their posters. Finally, groups are given a guide that aids them in making their posters by suggesting all the key components one would find in any research paper or presentation. This activity is suitable for presenting final project posters to classmates or to a wider audience in a symposium or expo environment. In addition to the poster-making guide, three worksheets, six example posters, a rubric and a post-unit survey are provided.
Students will compare data for two states using comparison symbols and both …
Students will compare data for two states using comparison symbols and both rounded and unrounded (exact) numbers. Students will then write their own question to compare the data.
No restrictions on your remixing, redistributing, or making derivative works. Give credit to the author, as required.
Your remixing, redistributing, or making derivatives works comes with some restrictions, including how it is shared.
Your redistributing comes with some restrictions. Do not remix or make derivative works.
Most restrictive license type. Prohibits most uses, sharing, and any changes.
Copyrighted materials, available under Fair Use and the TEACH Act for US-based educators, or other custom arrangements. Go to the resource provider to see their individual restrictions.