Updating search results...

Search Resources

1432 Results

View
Selected filters:
  • climate-change
First-ever look at microbial diversity in Antarctic soils
Unrestricted Use
CC BY
Rating
0.0 stars

This resource is a video abstract of a research paper created by Research Square on behalf of its authors. It provides a synopsis that's easy to understand, and can be used to introduce the topics it covers to students, researchers, and the general public. The video's transcript is also provided in full, with a portion provided below for preview:

"As global warming persists, it’s becoming clear that even the smallest forms of life need protection, including in the cold deserts of Antarctica. But scientists know very little about the microbes that make their home in Antarctic soil, leaving the picture of biodiversity and ecological change in this region incomplete. Now, researchers from Australia are filling in the blanks. They’ve conducted the first-ever microbial biodiversity report for two Antarctic regions: the extremely dry Vestfold Hills and the Windmill Islands. Bacterial communities in both areas were dominated by microbes of the metabolically and physiologically diverse phylum Actinobacteria, but the Vestfold Hills showed a higher prevalence of members of the Bacteriodetes phylum, likely due to the saltier soils found in this region. Overall, the observed diversity of community members suggests that microbes have found a way to share their environment equitably..."

The rest of the transcript, along with a link to the research itself, is available on the resource itself.

Subject:
Biology
Life Science
Material Type:
Diagram/Illustration
Reading
Provider:
Research Square
Provider Set:
Video Bytes
Date Added:
05/05/2020
Five-Year Average Global Temperature Anomalies from 1881 to 2009
Unrestricted Use
CC BY
Rating
0.0 stars

This NASA animation of the Five-Year Average Global Temperature Anomalies from 1881 to 2009 shows how temperature anomalies have varied in the last 130 years. The color-coded map displays a long-term progression of changing global surface temperatures from 1881 to 2009. Dark red indicates the greatest warming and dark blue indicates the greatest cooling.

Subject:
Applied Science
Career and Technical Education
Environmental Science
Environmental Studies
Physical Science
Provider:
CLEAN: Climate Literacy and Energy Awareness Network
Provider Set:
CLEAN: Climate Literacy and Energy Awareness Network
Author:
NASA/Goddard Space Flight Center Scientific Visualization Studio
Date Added:
06/19/2012
Flow: Currents and Climate
Read the Fine Print
Educational Use
Rating
0.0 stars

This video introduces viewers to oceanic thermohaline circulation - the system of global ocean currents that cycle warm and cold water across the planet.

Subject:
Applied Science
Atmospheric Science
Career and Technical Education
Environmental Science
Environmental Studies
Oceanography
Physical Science
Material Type:
Diagram/Illustration
Reading
Provider:
CLEAN: Climate Literacy and Energy Awareness Network
Provider Set:
CLEAN: Climate Literacy and Energy Awareness Network
Author:
National Oceanic and Atmospheric Administration
Science On a Sphere
Date Added:
07/28/2022
Flubber Flow
Read the Fine Print
Educational Use
Rating
0.0 stars

Flubber Flow is a 30-minute activity in which teams of four to five children experiment with Flubber and investigate how a solid can flow! They predict and model the properties of glaciers, view images of advancing glaciers, and create their own Flubber flow.

Subject:
Applied Science
Career and Technical Education
Environmental Science
Environmental Studies
Physical Science
Material Type:
Activity/Lab
Provider:
CLEAN: Climate Literacy and Energy Awareness Network
Provider Set:
CLEAN: Climate Literacy and Energy Awareness Network
Author:
Lunar and Planetary Institute
Date Added:
07/12/2021
Fluid Earth Viewer
Read the Fine Print
Educational Use
Rating
0.0 stars

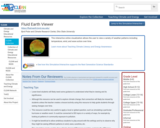
This interactive online visualization allows the user to view a variety of weather patterns including temperature, wind, and wave action over time.

Subject:
Applied Science
Atmospheric Science
Career and Technical Education
Environmental Science
Environmental Studies
Oceanography
Physical Science
Material Type:
Reading
Simulation
Provider:
CLEAN: Climate Literacy and Energy Awareness Network
Provider Set:
CLEAN: Climate Literacy and Energy Awareness Network
Author:
Byrd Polar and Climate Research Center
Ohio State University
Date Added:
07/27/2022
Following a Devastating Tornado, Town and Hospital Rebuild to Harness Wind Energy
Read the Fine Print
Rating
0.0 stars

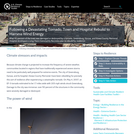
After 90 percent of the town was damaged or destroyed by a tornado, Greensburg, Kansas, and Kiowa County Memorial Hospital developed a Long-Term Community Recovery plan to rebuild for resilience.

Subject:
Atmospheric Science
Physical Science
Material Type:
Case Study
Provider:
National Oceanic and Atmospheric Administration
Provider Set:
U.S. Climate Resilience Toolkit
Date Added:
08/09/2016
Food, Farming, and Justice: A role play on La VÃa Campesina
Read the Fine Print
Educational Use
Rating
0.0 stars

This resource has students role-play as farmers from around the world and consider how agricultural practices are part of climate solutions. This resource includes role-play activities for students to learn more about La Via Campesina, one of the largest social movements around the world. Students get to discuss why they may not have heard of this in their history books and embody La Via Campesina activists.

Subject:
Agriculture
Applied Science
Career and Technical Education
Environmental Science
Environmental Studies
Physical Science
Material Type:
Activity/Lab
Provider:
CLEAN: Climate Literacy and Energy Awareness Network
Provider Set:
CLEAN: Climate Literacy and Energy Awareness Network
Author:
Bill Bigelow
Chris Buehler
Julie Treick O'Neill
Tim Swinehart
Zinn Education Project
Date Added:
07/13/2022
Food Waste & Our Planet
Conditional Remix & Share Permitted
CC BY-NC
Rating
0.0 stars

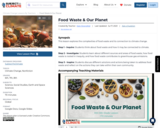
SYNOPSIS: This lesson explores the complexities of food waste and its connection to climate change.

SCIENTIST NOTES: This lesson illustrates the concept of food waste and food loss and provides initiatives to reduce food waste. This will not only help in improving food security but is a good alternative to drawdown greenhouse gas emissions from food waste. All materials have been fact-checked, and the lesson is credible for teaching.

POSITIVES:
-This lesson includes a diverse set of perspectives, communities, and solutions.
-Students are able to learn about the complexity of food waste from different contexts.

ADDITIONAL PREREQUISITES:
-Students are likely to have different perspectives and emotions regarding food waste. It can be an overwhelming experience to learn about the severity of this problem. This lesson embeds questions to give students time and space to process these emotions and inequities.
-The Big Waste video contains some statistics from 2012-2013, so some data may be outdated and obsolete.

DIFFERENTIATION:
-Seeing the severity and inequities of food waste might cause feelings of anxiety, sadness, anger, despair, or surprise in some students. It is recommended for teachers to remind them that those feelings are normal and natural. Sharing those feelings with the class can help support students’ social-emotional learning. It is recommended to encourage students to share their honest reactions.
-This exploration and these discussions might naturally lead into the “What can we do about it?” discussion.

Subject:
Geoscience
Physical Science
Social Science
Space Science
Material Type:
Lesson Plan
Provider:
SubjectToClimate
Author:
Kate Strangfeld
Date Added:
06/30/2023
Food Waste & Our Planet
Conditional Remix & Share Permitted
CC BY-NC
Rating
0.0 stars

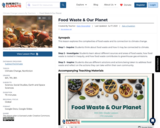
This lesson explores the complexities of food waste and its connection to climate change.

Step 1 - Inquire: Students think about food waste and how it may be connected to climate.

Step 2 - Investigate: Students learn about different sources and areas of food waste, how food waste is rooted in inequity, and how food waste contributes to greenhouse gas emissions.

Step 3 - Inspire: Students discuss different solutions and actions being taken to address food waste and reflect on the actions they can take within their own community.

Subject:
Applied Science
Environmental Science
Material Type:
Lesson
Lesson Plan
Provider:
SubjectToClimate
Author:
Kate Strangfeld
Date Added:
03/15/2023
The Food We Eat Can Have a Positive Impact on Climate Justice
Conditional Remix & Share Permitted
CC BY-NC-SA
Rating
0.0 stars

In this psychology real-life investigation, students investigate the food on their plates, identify the source location of the foods they consume on a regular basis, and calculate their carbon footprint. The goal is to identify their diet (its source of origin – where was it grown, packaged, shipped from, etc.), its impact on their subjective well-being (also known as "happiness"), and its impact on their health as well as climate justice. Students conduct research to identify one potentially problematic ingredient that they frequently ingest. The idea here is for the students to investigate their carbon footprint and reflect on their current dietary choices, and also consider food ingredient(s) that might be detrimental to their well-being, such as increasing the vulnerability to certain diseases such as COVID-19, cancer, diabetes, etc. The goal is to widen students' awareness and encourage them to make up their own minds about their dietary choices while considering new directions to take. Furthermore, with the encouragement of a TED Talk on the power of talking about climate change with others, students are asked to create/design an infographic to effectively engage with the larger community on the issues of climate change and climate justice, and then use the infographic to talk to friends and family about what you are learning about climate change and climate justice.

Subject:
Agriculture
Applied Science
Career and Technical Education
Environmental Science
Environmental Studies
Health, Medicine and Nursing
Psychology
Social Science
Material Type:
Activity/Lab
Provider Set:
Teach the Earth
Author:
Deepti Karkhanis
Date Added:
08/04/2022
Food & Water Security
Unrestricted Use
CC BY
Rating
0.0 stars

Short Description:
Drawing upon the food security literature and current events in the media, this survey course will encourage learners to build a new understanding of food security, water shortages in agricultural production, and climate change challenges in agriculture. We will introduce policy tools and case studies illustrating the effects that climate change has on agriculture which will be useful and applicable to individual cross-disciplinary learning.

Long Description:
Food security is one of the most pressing dilemmas of our time. Around the globe, approximately 2 billion people experience some form of food deprivation each day. One in ten people suffer from some form of food insecurity in Canada. This has led scholars to question why food insecurity exists in an ostensibly food secure country. The literature on food security and climate change has also grown exponentially over the past several decades in large part as a response to world events such as the Green Revolution and other forms of industrial agricultural development since the 1970s. Despite the advances in research and technology, we still possess inadequate knowledge of the dynamics causing the onset of food insecurity, and significant disagreement persists among scholars concerning the best way to ameliorate food insecurity.

Drawing upon the food security literature and current events in the media, this survey course will encourage learners to build a new understanding of food security, water shortages in agricultural production, and climate change challenges in agriculture. We will introduce policy tools and case studies illustrating the effects that climate change has on agriculture which will be useful and applicable to individual cross-disciplinary learning.

This course is part of the Adaptation Learning Network led by the Resilience by Design Lab at Royal Roads University. The project is supported by the Climate Action Secretariat of the BC Ministry of Environment & Climate Change Strategy and Natural Resources Canada through its Building Regional Adaptation Capacity and Expertise (BRACE) program. The BRACE program works with Canadian provinces to support training activities that help build skills and expertise on climate adaptation and resilience.

Word Count: 19025

(Note: This resource's metadata has been created automatically by reformatting and/or combining the information that the author initially provided as part of a bulk import process.)

Subject:
Atmospheric Science
Career and Technical Education
Culinary Arts
Environmental Studies
Hydrology
Physical Science
Material Type:
Textbook
Author:
Dr Joanne Taylor
Date Added:
03/11/2022
Food and Climate Change
Read the Fine Print
Educational Use
Rating
0.0 stars

In this activity, students listen to a podcast and then investigate causes of and solutions to food waste, plant-based recipes to get excited about, and the diversity and variety of heirloom foods.

Subject:
Agriculture
Applied Science
Career and Technical Education
Environmental Science
Environmental Studies
Physical Science
Material Type:
Activity/Lab
Provider:
CLEAN: Climate Literacy and Energy Awareness Network
Provider Set:
CLEAN: Climate Literacy and Energy Awareness Network
Author:
Environmental Solutions Initiative
Massachusetts Institute of Technology
Date Added:
08/01/2022
Food and Climate Change Curriculum
Read the Fine Print
Educational Use
Rating
0.0 stars

Comprehensive curriculum/unit to teach how food systems affect climate change. Strong use of real data is embedded throughout. Full lessons, mini-lessons, and short videos are presented.

Subject:
Agriculture
Applied Science
Biology
Career and Technical Education
Environmental Science
Environmental Studies
Life Science
Physical Science
Material Type:
Lesson
Lesson Plan
Provider:
CLEAN: Climate Literacy and Energy Awareness Network
Provider Set:
CLEAN: Climate Literacy and Energy Awareness Network
Author:
Alana Siegner
Date Added:
06/20/2019
Forecasting Climate Variability and Change: A Matter of Survival
Read the Fine Print
Rating
0.0 stars

In this activity, students explore past examples of climate variability in three locations: the Peruvian and Bolivian Andes, Central America, and coastal Greenland, and consider differences between climate variability and climate change.

Subject:
Applied Science
Career and Technical Education
Environmental Science
Environmental Studies
Physical Science
Material Type:
Activity/Lab
Provider:
CLEAN: Climate Literacy and Energy Awareness Network
Provider Set:
CLEAN: Climate Literacy and Energy Awareness Network
Author:
Cindy Shellito
SERC, Carlton College
Date Added:
09/24/2018
Forecasting Lake Effect Snow in Lake Superior region
Conditional Remix & Share Permitted
CC BY-NC-SA
Rating
0.0 stars

This exercise is designed to present the realistic problems of forecasting weather. Lake effect snows are hard to forecast because they depend on information that isn't part of the regular set of information and involve some pretty specific things that integrate the location of the site with surrounding environment. Even places close by can get totally different forecasts. When you have a regional forecast, it doesn't really address lake effect snows, unless the forecaster really focuses. So the exercise aims to show the value of broad critical thinking in meteorology, and it is very dramatic, because the difference between 36 inches and whiteout and clear blue sky is undeniable. The exercise comes when students are 8 weeks into the class. The class is an AMS based class, which has already been described well in this workshop by Julie Snow from Slippery Rock. Our class is given in the fall semester and lake effect snow starts in October and is quite an issue in forecasts until April. The skills of a forecaster are tested, and you cannot use forecasts from nearby areas reliably. Finally, we live in a fantastic snow belt, so lake effect snow happens a lot. In a good year we get over 300 inches of snow, mostly at times that places nearby do not. You can drive to Houghton in the bright sun and be met by a wall of very active blizzard just a few miles out of town.

There are some excellent tutorials available from COMET, and outreach of the National Weather Service. I use one done by Greg Byrd, which is available online or in a power point format. There are a number of things that must be learned before forecasting. These include some fluid dynamics of plumes, latent heat, remote sensing, upper air mapping, and the use of models. We cannot cover all them completely. I try to introduce all these things and give people entry points into the juicy parts of these topics, but do not expect students to understand completely. One thing you can spend a long time on are the satellite images. Here is one, just to whet your interest: http://serc.carleton.edu/details/images/13586.html


I have the students make a list of the critical parameters they think might be needed for a successful lake effect forecast. This is a challenge to prepare, but the idea is to include things that are even marginally useful and to collect data to see what is most important. We get a list of parameters like this:


850 mb wind direction
850 mb temperature
Lake Superior surface temperature
fetch length
opposing bay?
Inversion layer height
topographic lift factor
wind shear evidence
upstream lake
upstream moisture factor
snow/ice cover issues


This list is pretty good, but deliberately not complete, and we encourage students to add other things they think might be important. The next step is to find where you can get this information. I have web data sources for most (see below), and some of them are interrelated. You can do this exercise for any site around Lake Superior or probably many other lakes as well. For specific sites, the fetch length, upstream lake and opposing bay information are obtainable directly from the wind direction if you have a good map (Google Earth). So a spreadsheet for parameters related to wind direction can be prepared in advance and these parameters can be immediately available from the wind direction. Nonetheless the issue of sources for all this stuff must be addressed in an effort that spans several hours. The use of models is needed to look into the future where possible.

Once students know what they are looking for and how to find it, the exercise starts its data collection. Every day or every 6 or 12 hours beginning when conditions get close to "LES favorable" students collect information on these LES predictors. They also make LES forecasts for each period and include that information in the spreadsheet. The next day the real snowfall data is added to the spreadsheet, and this can be used as validation data for the forecast. This data collection needs to be done for several weeks (November and December in my case, usually a good time for LES).

The data analysis is the most challenging part. Spreadsheet plots which test the sensitivity of various parameters singly and together are possible. There is a lot of sophistication possible if there is enough LES to analyze. Overall, results should be a good experience with imperfect data addressed to a real-time problem. Models and real data, remote sensing, and balloons are all integrated and there are quite obvious weaknesses.

On the final day of class student groups will compete by doing forecasting which employs the LES techniques. This might reflect the most recent snow event. A more important element of this submission will be their evaluation of LES prediction parameters. Not only do we consider the actual forecast, but we discuss which parameters were successful? Which are inconclusive? What suggestions for improved forecasts are possible from the experience? The format of this will be short presentations with time for discussion.

(Note: this resource was added to OER Commons as part of a batch upload of over 2,200 records. If you notice an issue with the quality of the metadata, please let us know by using the 'report' button and we will flag it for consideration.)

Subject:
Applied Science
Atmospheric Science
Biology
Environmental Science
Life Science
Mathematics
Measurement and Data
Physical Science
Material Type:
Activity/Lab
Provider:
Science Education Resource Center (SERC) at Carleton College
Provider Set:
Teach the Earth
Author:
Bill Rose
Date Added:
08/24/2019
Forest Management Simulation
Unrestricted Use
CC BY
Rating
0.0 stars

This lesson was developed by Wild Whatcom (www.wildwhatcom.org) for the Clime Time initiative. The lesson included expands on knowledge of Forest Succession. This outdoor lesson can happen in any natural setting whether it be on a school play field, in a garden, or in a forest. The lesson allows students to role play what it would be like to live in a forest undergoing natural occurances with varying effects due to different management styles. This lesson is best conducted after the concepts of forest succession or natural extreme weather patterns have been discussed.

Subject:
Arts and Humanities
Environmental Science
Forestry and Agriculture
Material Type:
Interactive
Lesson Plan
Author:
Hannah Newell
Date Added:
03/26/2020
Forest Management and the Carbon Cycle
Conditional Remix & Share Permitted
CC BY-NC-SA
Rating
0.0 stars

Students begin this activity by using the IPCC4, carbon diagram to distinguish natural and anthropogenic carbon. (A point that students may need to have clarified is that CO2 from natural and anthropogenic sources is the same molecule.). Students begin with Activity 1 , calculating the overall carbon transfer for a year, followed by an examination of the role of forests in the carbon cycle. This suite of activities includes 7 parts, and the selection of additional activities depends upon the discretion of the instructor and focus of the class.

(Note: this resource was added to OER Commons as part of a batch upload of over 2,200 records. If you notice an issue with the quality of the metadata, please let us know by using the 'report' button and we will flag it for consideration.)
Subject:
Agriculture
Applied Science
Biology
Career and Technical Education
Chemistry
Environmental Science
Life Science
Mathematics
Measurement and Data
Physical Science
Statistics and Probability
Material Type:
Activity/Lab
Provider:
Science Education Resource Center (SERC) at Carleton College
Provider Set:
Teach the Earth
Author:
Sarah Brylinsky
Date Added:
08/06/2022
Fortifying Chicago's Urban Forest
Read the Fine Print
Rating
0.0 stars

Trees within a city can help reduce urban heat, control stormwater, and provide habitat to local wildlife. As climate conditions change, a Chicago group is working to enhance its urban forest so that the city can continue to receive these benefits.

Subject:
Atmospheric Science
Physical Science
Material Type:
Case Study
Provider:
National Oceanic and Atmospheric Administration
Provider Set:
U.S. Climate Resilience Toolkit
Date Added:
08/30/2016
Fostering Dialogue to Support Community Resilience
Read the Fine Print
Educational Use
Rating
0.0 stars

This video outlines background and goals of resilience with a focus on communities and climate resilience.

Subject:
Applied Science
Career and Technical Education
Environmental Science
Environmental Studies
Physical Science
Material Type:
Diagram/Illustration
Reading
Provider:
CLEAN: Climate Literacy and Energy Awareness Network
Provider Set:
CLEAN: Climate Literacy and Energy Awareness Network
Author:
Aspen Global Change Institute
Date Added:
07/28/2022