A whirl-wind tour of the statistics used in behavioral science research, covering …
A whirl-wind tour of the statistics used in behavioral science research, covering topics including: data visualization, building your own null-hypothesis distribution through permutation, useful parametric distributions, the generalized linear model, and model-based analyses more generally. Familiarity with MATLAB®, Octave, or R will be useful, prior experience with statistics will be helpful but is not essential. This course is intended to be a ground-up sketch of a coherent, alternative perspective to the "null-hypothesis significance testing" method for behavioral research (but don't worry if you don't know what this means).
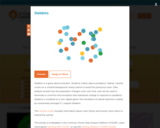
Stebbins is a game about evolution. Students collect data as predators "eating" …
Stebbins is a game about evolution. Students collect data as predators "eating" colored circles on a colored background, being careful to avoid the poisonous ones. Data analysis reveals how the population changes color over time, and can be used to illuminate a common misconception that individuals change in response to predation. Stebbins is modeled on a non-digital game-like simulation of natural selection created by evolutionary biologist G. Ledyard Stebbins.
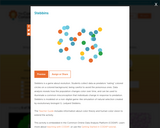
Stebbins is a game about evolution. Students collect data as predators “eating” …
Stebbins is a game about evolution. Students collect data as predators “eating” colored circles on a colored background, being careful to avoid the poisonous ones. Data analysis reveals how the population changes color over time, and can be used to illuminate a common misconception that individuals change in response to predation. Stebbins is modeled on a non-digital game-like simulation of natural selection created by evolutionary biologist G. Ledyard Stebbins.
Marketing research may be divided into methods that emphasize understanding "the customer" …
Marketing research may be divided into methods that emphasize understanding "the customer" and methods that emphasize understanding "the market." This course (15.822) deals with the market. The companion course (15.821) deals with the customer. The course will teach you how to write, conduct and analyze a marketing research survey. The emphasis will be on discovering market structure and segmentation, but you can pursue other project applications. A major objective of the course is to give you some "hands-on" exposure to analysis techniques that are widely used in consulting and marketing research factor analysis, perceptual mapping, conjoint, and cluster analysis). These techniques used to be considered advanced but now involve just a few keystrokes on most stat software packages. The course assumes familiarity with basic probability, statistics, and multiple linear regression.
The disciplines of music history and music theory have been slow to …
The disciplines of music history and music theory have been slow to embrace the digital revolutions that have transformed other fields' text-based scholarship (history and literature in particular). Computational musicology opens the door to the possibility of understanding—even if at a broad level—trends and norms of behavior of large repertories of music. This class presents the major approaches, results, and challenges of computational musicology through readings in the field, gaining familiarity with datasets, and hands on workshops and assignments on data analysis and "corpus" (i.e., repertory) studies. Class sessions alternate between discussion/lecture and labs on digital tools for studying music. A background in music theory and/or history is required, and experience in computer programming will be extremely helpful. Coursework culminates in an independent research project in quantitative or computational musicology that will be presented to the class as a whole.
Syllabus for the course "CSCI 381/780 - Data Analytics" delivered at Queens …
Syllabus for the course "CSCI 381/780 - Data Analytics" delivered at Queens College in Spring 2019 by Kumar Ramansenthil as part of the Tech-in-Residence Corps program.
Syllabus for the course "CSC 21700 - Probability and Statistics for Computer …
Syllabus for the course "CSC 21700 - Probability and Statistics for Computer Science" delivered at the City College of New York in Spring 2019 by Evan Agovino as part of the Tech-in-Residence Corps program.
The taphonomy project is a semester-long experiment the students design and run …
The taphonomy project is a semester-long experiment the students design and run themselves, using the decomposition studies area run by the Criminal Justice department on campus. Following a discussion of taphonomic processes during the first week, the students come up with original questions to test. Working in pairs, they design the experiment, including methods, materials, sampling interval, and taphonomic evaluation. The students set up the experiment in week 3 and monitor it over the course of the semester. They will be required to keep an experimental journal, data from which they will upload to a wiki page. The students will be required to periodically evaluate and comment on other student's projects. The professor will also periodically evaluate the groups' progress periodically through the wiki. The end result is a 20-minute presentation in the style of an oral paper at a conference given the week before finals. This project develops the students' skills in experimental design, data analysis and written, oral and visual communication.
(Note: this resource was added to OER Commons as part of a batch upload of over 2,200 records. If you notice an issue with the quality of the metadata, please let us know by using the 'report' button and we will flag it for consideration.)
This case study is retrieved from the open book Open Data as …
This case study is retrieved from the open book Open Data as Open Educational Resources. Case studies of emerging practice.
Course description:
Metrics and measurement are important strategic tools for understanding the world around us. To take advantage of the possibilities they offer, however, one needs the ability to gather, work with, and analyse datasets, both big and small. This is why metrics and measurement feature in the seminar course Technology and Evolving Forms of Publishing, and why data analysis was a project option for the Technology Project course in Simon Fraser University’s Master of Publishing Program.
The assignment:
“Data Analysis with Google Refine and APIs": Pick a dataset and an API of your choice (Twitter, VPL, Biblioshare, CrossRef, etc.) and combine them using Google Refine. Clean and manipulate your data for analysis. The complexity/messiness of your data will be taken into account”.
From "The Spectrum of Apple Flavors" to "We are all Zebras: How Rare …
From "The Spectrum of Apple Flavors" to "We are all Zebras: How Rare Disease is Shaping the Future of Healthcare," we find colorful visual displays of information and data used to persuade, inform and delight their audience-readers. Most infographic assignments result in loose collections of related facts and numbers, essentially a collage or poster. Student create displays of unrelated factoids and spurious data correlations and they "ooh" and "ahhh" at beautiful nothings. However, the visual and textual elements of an infographic can culminate in a coherent multimodal argument which prompts inquiry in the creator and the audience. In order to teach infographics as a claim expressed through visual metaphor, supported by reasoning with evidence in multiple modes, instructors employ a sequence of interventions to invoke the relevant skills and strategies at appropriate moments. Composing and critiquing infographics can enhance understanding of both the content and rhetoric, since people analyze, elaborate and critique information more deeply when visual and textal modes are combined (Lazard and Atkinson 2014).This pedagogy of reading and writing multiple literacies can be adapted to other multimodal products. For an overview, refer to "Recipe for an Infographic" (Abilock and Williams 2014) which is also listed in the references for this module. We recommend that you experience this process yourself as you teach it to students.
From "The Spectrum of Apple Flavors" to "We are all Zebras: How Rare …
From "The Spectrum of Apple Flavors" to "We are all Zebras: How Rare Disease is Shaping the Future of Healthcare," we find colorful visual displays of infGrotewold, K. (2020, August). Framework for analysis of visual information. In Assessing Visual Materials for Diversity & Inclusivity. https://www.oercommons.org/courseware/lesson/69336/. Licensed as CC BY-NC-SA
Principles of economics students are asked to collect and analyze data on …
Principles of economics students are asked to collect and analyze data on a few macro economic aggregates to give them a first taste of empirical work.
In order to promote students’ conceptual understanding and learning experience in introductory …
In order to promote students’ conceptual understanding and learning experience in introductory statistics, a technology task, which focuses on the probability distribution in which means are defined, was created using TinkerPlots, an exploratory data analysis and modeling software. The targeted audiences range from senior high school grade levels to college freshmen who are starting their introductory course in statistics. Students will be guided to explore and discover the movement behaviors of means of a set of numbers randomly generated from a fixed range of values characterized by a predetermined probability distribution. The cognitive, mathematical, technological and pedagogical natures of the task, as well as its association with the statistics education framework based on the Guidelines for Assessment and Instruction in Statistics Education (GAISE) by the American Statistical Association, will be elaborated. A brief discussion on what cognitive design principles this task satisfies will also be provided at the end.
This activity teaches students about the setting of Harper Lee’s famous novel …
This activity teaches students about the setting of Harper Lee’s famous novel “To Kill a Mockingbird,” which takes place during 3 years (1933–1935) of the Great Depression. Part 1 of this activity can be used before students start reading the novel to help them understand what life was like in the 1930s. In this part, students will examine and answer questions about census documents that feature unemployment numbers and related information. Part 2 can be completed after students have read the first few chapters of the novel. In this part, students will write a piece using the RAFT technique (role, audience, format, topic) to show what they learned about the 1930s and what they have read so far.
Course summary A minimal standard for data analysis and other scientific computations …
Course summary A minimal standard for data analysis and other scientific computations is that they be reproducible: that the code and data are assembled in a way so that another group can re-create all of the results (e.g., the figures in a paper). The importance of such reproducibility is now widely recognized, but it is still not so widely practiced as it should be, in large part because many computational scientists (and particularly statisticians) have not fully adopted the required tools for reproducible research.
In this course, we will discuss general principles for reproducible research but will focus primarily on the use of relevant tools (particularly make, git, and knitr), with the goal that the students leave the course ready and willing to ensure that all aspects of their computational research (software, data analyses, papers, presentations, posters) are reproducible.
This single instrumental qualitative case study explores and thickly describes job performance …
This single instrumental qualitative case study explores and thickly describes job performance outcomes based upon the manner in which self-directed learning activities of a purposefully selected sample of 3 construction managers are conducted, mediated by the use of Web 2.0 technology. The data collected revealed that construction managers are concerned with the performance expected of them, in addition to how well they perform their work-related activities (orientation to learning), indicating that organizations should provide guidelines on the use and expected outcomes of self-directed learning in addition to providing the tools, resources, and time (environmental factors) to match performance needs; construction managers feel that work-related activities expected of them, how well the work-related activities are performed, and consequences for poor performance at work are determining factors in selecting Web 2.0 technologies; while construction managers understand the need for rules restricting the use of Web 2.0 technologies in performing their jobs, they feel these rules do hinder their performance because access to specific information they need to answer a question, solve a problem, or research to learn something new is sometimes restricted; and successful performance outcomes are determined by compliance to expected performance behaviors of others, such as answering a question or solving a problem an architect or superintendent have presented, as well as expectations construction managers have set for themselves. The following are appended: (1) Call for Participation--Web 2.0 Technology Project; (2) Informed Consent Letter and Form/Template; (3) Semistructured Interview Guide; and (4) Permission to Conduct Research Study.
This activity is part of a larger module that introduces students to …
This activity is part of a larger module that introduces students to two different ways to model chemical diffusion in minerals: 1) 1D diffusion in Excel using finite differences and 2) 1D diffusion in MATLAB using the same equations. It is designed to help students apply diffusion equations derived previously in class to understand natural zonation of elements in minerals. The students build the model first in Excel, and then in MATLAB to obtain the timescales of diffusive re-equilibration related to magma storage and transport at KÃÂlauea Volcano, Hawai'i. The major goals are to help students transition from visual platforms (e.g., Excel) to writing computer code (e.g., in MATLAB), implementing for loops for iterative calculations, and thinking about how the geologic parameters (temperature, pressure, fO2) affect the model results.
The past decade has seen rapid growth in conversations around and progress …
The past decade has seen rapid growth in conversations around and progress towards fostering a more transparent, open, and cumulative science. Best practices are being codified and established across fields relevant to gerontology from cancer science to psychological science. Many of the areas currently under development are of particular relevance to gerontologists such as best practices in balancing open science with participant confidentiality or best practices for preregistering archival, longitudinal data analysis. The present panel showcases one of the particular strengths of the open science movement - the contribution that early career researchers are making to these ongoing conversations on best practices. Early career researchers have the opportunity to blend their expertise with technology, their knowledge of their disciplines, and their vision for the future in shaping these conversations. In this panel, three early career researchers share their insights. Pfund presents an introduction to preregistration and the value of preregistration from the perspective of “growing up” within the open science movement. Seaman discusses efforts in and tools for transparency and reproducibility in neuroimaging of aging research. Ludwig introduces the idea of registered reports as a particularly useful form of publication for researchers who use longitudinal methods and/or those who work with hard-to-access samples. The symposium will include time for the audience to engage the panel in questions and discussion about current efforts in and future directions for transparent, open, and cumulative science efforts in gerontology.
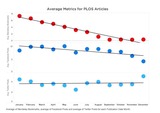
Background: Reproducible research is a foundational component for scientific advancements, yet little …
Background: Reproducible research is a foundational component for scientific advancements, yet little is known regarding the extent of reproducible research within the dermatology literature. Objective: This study aimed to determine the quality and transparency of the literature in dermatology journals by evaluating for the presence of 8 indicators of reproducible and transparent research practices. Methods: By implementing a cross-sectional study design, we conducted an advanced search of publications in dermatology journals from the National Library of Medicine catalog. Our search included articles published between January 1, 2014, and December 31, 2018. After generating a list of eligible dermatology publications, we then searched for full text PDF versions by using Open Access Button, Google Scholar, and PubMed. Publications were analyzed for 8 indicators of reproducibility and transparency—availability of materials, data, analysis scripts, protocol, preregistration, conflict of interest statement, funding statement, and open access—using a pilot-tested Google Form. Results: After exclusion, 127 studies with empirical data were included in our analysis. Certain indicators were more poorly reported than others. We found that most publications (113, 88.9%) did not provide unmodified, raw data used to make computations, 124 (97.6%) failed to make the complete protocol available, and 126 (99.2%) did not include step-by-step analysis scripts. Conclusions: Our sample of studies published in dermatology journals do not appear to include sufficient detail to be accurately and successfully reproduced in their entirety. Solutions to increase the quality, reproducibility, and transparency of dermatology research are warranted. More robust reporting of key methodological details, open data sharing, and stricter standards journals impose on authors regarding disclosure of study materials might help to better the climate of reproducible research in dermatology. [JMIR Dermatol 2019;2(1):e16078]
No restrictions on your remixing, redistributing, or making derivative works. Give credit to the author, as required.
Your remixing, redistributing, or making derivatives works comes with some restrictions, including how it is shared.
Your redistributing comes with some restrictions. Do not remix or make derivative works.
Most restrictive license type. Prohibits most uses, sharing, and any changes.
Copyrighted materials, available under Fair Use and the TEACH Act for US-based educators, or other custom arrangements. Go to the resource provider to see their individual restrictions.