CODAP (Common Online Data Analysis Platform) is an open-source data visualization and …
CODAP (Common Online Data Analysis Platform) is an open-source data visualization and analysis tool made available by the Concord Consortium. It's available at https://codap.concord.org/. CODAP can be used across the curriculum to help students summarize, visualize, and interpret data, advancing their skills to use data as evidence to support a claim.
This professional learning resource includes guides to get started, tutorials that demonstrate the features and functionality of CODAP, sample lessons, and links to online forum sites.
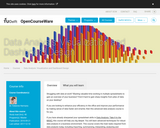
This course is for all of those struggling with data analysis. That …
This course is for all of those struggling with data analysis. That crazy data collection from your boss? Megabytes of sensor data to analyze? Looking for a smart way visualize your data in order to make sense out of it? We’ve got you covered!
Using video lectures and hands-on exercises, we will teach you cutting-edge techniques and best practices that will boost your data analysis and visualization skills.
This course has been awarded with the Wharton-QS gold education award in the category Regional awards Europe. We will take a deep dive into data analysis with spreadsheets: PivotTables, VLOOKUPS, Named ranges, what-if analyses, making great graphs – all those will be covered in the first weeks of the course. After that, we will investigate the quality of the spreadsheet model, and especially how to make sure your spreadsheet remains error-free and robust.
Finally, once we have mastered spreadsheets, we will demonstrate other ways to store and analyze data. We will also look into how Python, a programming language, can help us with analyzing and manipulating data in spreadsheets.
This course is created using Excel 2013 and Windows. Most assignments can be made using another spreadsheet program and operating system as well, but we cannot offer full support for all configurations.
Struggling with data at work? Wasting valuable time working in multiple spreadsheets …
Struggling with data at work? Wasting valuable time working in multiple spreadsheets to gain an overview of your business? Find it hard to gain sharp insights from piles of data on your desktop?
If you are looking to enhance your efficiency in the office and improve your performance by making sense of data faster and smarter, then this advanced data analysis course is for you.
If you have already sharpened your spreadsheet skills in Data Analysis: Take It to the MAX(), this course will help you dig deeper. You will learn advanced techniques for robust data analysis in a business environment. This course covers the main tasks required from data analysts today, including importing, summarizing, interpreting, analyzing and visualizing data. It aims to equip you with the tools that will enable you to be an independent data analyst. Most techniques will be taught in Excel with add-ons and free tools available online. We encourage you to use your own data in this course but if not available, the course team can provide.
These course materials are part of an online course of TU Delft. Do you want to experience an active exchange of information between academic staff and students? Then join the community of online learners and enroll in this MOOC. This course is part of the Data Analysis XSeries.
These activities support students as they conceptually develop a sense of how …
These activities support students as they conceptually develop a sense of how probability affects the outcome of games. Students will find that applying their knowledge of probability will help them win some of the games
Python is a general purpose programming language that is useful for writing …
Python is a general purpose programming language that is useful for writing scripts to work effectively and reproducibly with data. This is an introduction to Python designed for participants with no programming experience. These lessons can be taught in one and a half days (~ 10 hours). They start with some basic information about Python syntax, the Jupyter notebook interface, and move through how to import CSV files, using the pandas package to work with data frames, how to calculate summary information from a data frame, and a brief introduction to plotting. The last lesson demonstrates how to work with databases directly from Python.
Data Carpentry lesson from Ecology curriculum to learn how to analyse and …
Data Carpentry lesson from Ecology curriculum to learn how to analyse and visualise ecological data in R. Data Carpentry’s aim is to teach researchers basic concepts, skills, and tools for working with data so that they can get more done in less time, and with less pain. The lessons below were designed for those interested in working with ecology data in R. This is an introduction to R designed for participants with no programming experience. These lessons can be taught in a day (~ 6 hours). They start with some basic information about R syntax, the RStudio interface, and move through how to import CSV files, the structure of data frames, how to deal with factors, how to add/remove rows and columns, how to calculate summary statistics from a data frame, and a brief introduction to plotting. The last lesson demonstrates how to work with databases directly from R.
Python is a general purpose programming language that is useful for writing …
Python is a general purpose programming language that is useful for writing scripts to work effectively and reproducibly with data. This is an introduction to Python designed for participants with no programming experience. These lessons can be taught in a day (~ 6 hours). They start with some basic information about Python syntax, the Jupyter notebook interface, and move through how to import CSV files, using the pandas package to work with data frames, how to calculate summary information from a data frame, and a brief introduction to plotting. The last lesson demonstrates how to work with databases directly from Python.
Understanding the types, processes, and frameworks of workflows and analyses is helpful …
Understanding the types, processes, and frameworks of workflows and analyses is helpful for researchers seeking to understand more about research, how it was created, and what it may be used for. This lesson uses a subset of data analysis types to introduce reproducibility, iterative analysis, documentation, provenance and different types of processes. Described in more detail are the benefits of documenting and establishing informal (conceptual) and formal (executable) workflows.
This course introduces methods for harnessing data to answer questions of cultural, …
This course introduces methods for harnessing data to answer questions of cultural, social, economic, and policy interest. We will start with essential notions of probability and statistics. We will proceed to cover techniques in modern data analysis: regression and econometrics, design of experiments, randomized control trials (and A/B testing), machine learning, and data visualization. We will illustrate these concepts with applications drawn from real-world examples and frontier research. Finally, we will provide instruction on the use of the statistical package R, and opportunities for students to perform self-directed empirical analyses. MITx Online This course draws materials from 14.310x Data Analysis for Social Scientists, which is part of the MicroMasters Program in Data, Economics, and Design of Policy offered by MITx Online. The MITx Online course is entirely free to audit, though learners have the option to pay a fee, which is based on the learner’s ability to pay, to take the proctored exam and earn a course certificate. To access that course, create an MITx Online account and enroll in the course 14.310x Data Analysis for Social Scientists.
This open resources textbook contains 10 Units that describe and explain the …
This open resources textbook contains 10 Units that describe and explain the main concepts in statistical analysis of psychological data (managing data, measures of central tendency, measures of spread, correlations, simple linear regression). In addition to conceptual descriptions and explanations of the basic analyses for descriptive statistics, this textbook also explains how to conduct those analyses with common statistical software (Excel) and open-source free software (R). This book is directed to undergraduates studying basic statistics, especially basic statistics in psychological research.
Short Description: This open resources textbook contains 10 Units that describe and …
Short Description: This open resources textbook contains 10 Units that describe and explain the main concepts in statistical analysis of psychological data. In addition to conceptual descriptions and explanations of the basic analyses for descriptive statistics, this textbook also explains how to conduct those analyses with common statistical software (Excel) and open-source free software (R).
Word Count: 27173
(Note: This resource's metadata has been created automatically by reformatting and/or combining the information that the author initially provided as part of a bulk import process.)
The A2DataDive assembled representatives from nonprofit organizations, U-M statistics and data sciences …
The A2DataDive assembled representatives from nonprofit organizations, U-M statistics and data sciences departments, and members of the community to collectively address the data analysis and visualization needs for area nonprofits and local organizations. Open.Michigan was one of the organizers of the A2DataDive, and worked with two School of Information graduate students to scope and implement the event. After identifying two organizations who had data needs:ŰÖFocus HopeŰÖand theŰÖAfrican Health OER Network, this joint community/university datadive took place over a weekend in February 2012 in North Quads space 2435, an adaptable space especially suited to collaborative, participatory work. The A2DataDive was a successful proof-of-concept for a joint collaboration between an academic institution and local organizations and businesses, and demonstrated that sharing skills and expertise to address a need is also a great way to help others.
Learn how instructional designers use data to inform the creation of a …
Learn how instructional designers use data to inform the creation of a Learning Persona. Learning Personas help determine the needs of the training and help ...
This is a desktop application for visualization of data with convenient plotting …
This is a desktop application for visualization of data with convenient plotting functions. It is intended for educational/scientific use and teaching data analysis skills such as aggregation, merging data and getting statistics. Though the program has a spreadsheet like interface, the focus is on data manipulation with very configurable 2D/3D plotting rather than data entry. Though basic cell editing and row/column changes are supported. The program is open source., licensed under the GPL. This program is suitable for use by secondary school and third level students wishing to learn about data manipulation and advanced plotting.
Course Description: This course covers the management of healthcare data, selected data …
Course Description: This course covers the management of healthcare data, selected data management topics with current importance in the field, and how to use statistical methods in data analysis.
Learning Objectives: Upon completion of the course students should be able to: 1. Describe analytics and decision support. 2. Validate the reliability and accuracy of secondary data sources. 3. Identify data sources requiring data management and analytics skills. 4. Demonstrate the statistical methods used in data analysis.
Good data organization is the foundation of any research project. Most researchers …
Good data organization is the foundation of any research project. Most researchers have data in spreadsheets, so it’s the place that many research projects start. We organize data in spreadsheets in the ways that we as humans want to work with the data, but computers require that data be organized in particular ways. In order to use tools that make computation more efficient, such as programming languages like R or Python, we need to structure our data the way that computers need the data. Since this is where most research projects start, this is where we want to start too! In this lesson, you will learn: Good data entry practices - formatting data tables in spreadsheets How to avoid common formatting mistakes Approaches for handling dates in spreadsheets Basic quality control and data manipulation in spreadsheets Exporting data from spreadsheets In this lesson, however, you will not learn about data analysis with spreadsheets. Much of your time as a researcher will be spent in the initial ‘data wrangling’ stage, where you need to organize the data to perform a proper analysis later. It’s not the most fun, but it is necessary. In this lesson you will learn how to think about data organization and some practices for more effective data wrangling. With this approach you can better format current data and plan new data collection so less data wrangling is needed.
Lesson on spreadsheets for social scientists. Good data organization is the foundation …
Lesson on spreadsheets for social scientists. Good data organization is the foundation of any research project. Most researchers have data in spreadsheets, so it’s the place that many research projects start. Typically we organize data in spreadsheets in ways that we as humans want to work with the data. However computers require data to be organized in particular ways. In order to use tools that make computation more efficient, such as programming languages like R or Python, we need to structure our data the way that computers need the data. Since this is where most research projects start, this is where we want to start too! In this lesson, you will learn: Good data entry practices - formatting data tables in spreadsheets How to avoid common formatting mistakes Approaches for handling dates in spreadsheets Basic quality control and data manipulation in spreadsheets Exporting data from spreadsheets In this lesson, however, you will not learn about data analysis with spreadsheets. Much of your time as a researcher will be spent in the initial ‘data wrangling’ stage, where you need to organize the data to perform a proper analysis later. It’s not the most fun, but it is necessary. In this lesson you will learn how to think about data organization and some practices for more effective data wrangling. With this approach you can better format current data and plan new data collection so less data wrangling is needed.
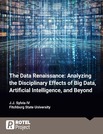
The Data Renaissance delves into the complexities of data's role in various …
The Data Renaissance delves into the complexities of data's role in various industries and its broader impact on society. It highlights the challenges in investigating data practices, citing examples like TikTok, where algorithms and data handling are closely guarded secrets. The content, contributed by students under the guidance of an expert, covers a wide range of topics, including the ethical aspects of generative AI in education and the workplace, and case studies reflecting real-world experiences. This evolving text, intended to be updated with each class, serves as a dynamic resource for educators and students alike, offering insights and discussion guides for an in-depth understanding of the ever-changing landscape of data in our digital age.
No restrictions on your remixing, redistributing, or making derivative works. Give credit to the author, as required.
Your remixing, redistributing, or making derivatives works comes with some restrictions, including how it is shared.
Your redistributing comes with some restrictions. Do not remix or make derivative works.
Most restrictive license type. Prohibits most uses, sharing, and any changes.
Copyrighted materials, available under Fair Use and the TEACH Act for US-based educators, or other custom arrangements. Go to the resource provider to see their individual restrictions.