In this informational text, elementary school readers learn about the difference between …
In this informational text, elementary school readers learn about the difference between weather and climate and about components of the climate system. The text can be used to practice visualizing and other comprehension strategies. Available in K-2 and 3-5 grade bands and as an illustrated book as well as a text document, the story appears in the online magazine Beyond Weather and the Water Cycle.
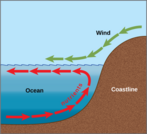
"This undergraduate class is designed to introduce students to the physics that …
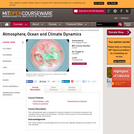
"This undergraduate class is designed to introduce students to the physics that govern the circulation of the ocean and atmosphere. The focus of the course is on the processes that control the climate of the planet.AcknowledgmentsProf. Ferrari wishes to acknowledge that this course was originally designed and taught by Prof. John Marshall."
In this experiment, two chemicals that can be found around the house …
In this experiment, two chemicals that can be found around the house will be mixed within a plastic baggie, and several chemical changes will be observed.
Experiment with a helium balloon, a hot air balloon, or a rigid …
Experiment with a helium balloon, a hot air balloon, or a rigid sphere filled with different gases. Discover what makes some balloons float and others sink.
Biology is designed for multi-semester biology courses for science majors. It is …
Biology is designed for multi-semester biology courses for science majors. It is grounded on an evolutionary basis and includes exciting features that highlight careers in the biological sciences and everyday applications of the concepts at hand. To meet the needs of today’s instructors and students, some content has been strategically condensed while maintaining the overall scope and coverage of traditional texts for this course. Instructors can customize the book, adapting it to the approach that works best in their classroom. Biology also includes an innovative art program that incorporates critical thinking and clicker questions to help students understand—and apply—key concepts.
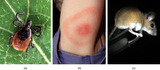
By the end of this section, you will be able to:Define biogeographyList …
By the end of this section, you will be able to:Define biogeographyList and describe abiotic factors that affect the global distribution of plant and animal speciesCompare the impact of abiotic forces on aquatic and terrestrial environmentsSummarize the affect of abiotic factors on net primary productivity
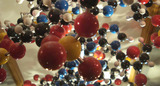
By the end of this section, you will be able to:Describe the …
By the end of this section, you will be able to:Describe the properties of water that are critical to maintaining lifeExplain why water is an excellent solventProvide examples of water’s cohesive and adhesive propertiesDiscuss the role of acids, bases, and buffers in homeostasis
How does the blackbody spectrum of the sun compare to visible light? …
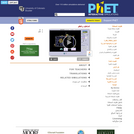
How does the blackbody spectrum of the sun compare to visible light? Learn about the blackbody spectrum of the sun, a light bulb, an oven, and the earth. Adjust the temperature to see the wavelength and intensity of the spectrum change. View the color of the peak of the spectral curve.
A new instructional model, called Argument-Driven Inquiry (ADI), is introduced to elementary …
A new instructional model, called Argument-Driven Inquiry (ADI), is introduced to elementary teachers in this article. The author shows how school librarians and classroom teachers can collaborate to help students construct and communicate evidence, or arguments. Evidence buckets, a collaborative activity, and related online resources are presented. The article appears in the free online magazine Beyond Weather and the Water Cycle, which is structured around the seven essential principles of climate literacy.
Getting Started: This lesson is designed to be used within the heat …
Getting Started:
This lesson is designed to be used within the heat transfer unit as an engineering design project.
My goal is to teach students:
The difference in heat conductivity of different materials. Engage students in thinking about the principles of engineering (designing to meet criteria determined by the desired result).
Total class time:
170 minutes (2 class blocks, 1 period for demo, in-class design, 1 period for student-requested informational experiments).
Construct and measure the energy efficiency and solar heat gain of a …
Construct and measure the energy efficiency and solar heat gain of a cardboard model house. Use a light bulb heater to imitate a real furnace and a temperature sensor to monitor and regulate the internal temperature of the house. Use a bright bulb in a gooseneck lamp to model sunlight at different times of the year, and test the effectiveness of windows for passive solar heating.
In this class, concepts of building technology and experimental methods are studied, …
In this class, concepts of building technology and experimental methods are studied, in class and in lab assignments. Projects vary yearly and have included design and testing of strategies for daylighting, passive heating and cooling, and improved indoor air quality via natural ventilation. Experimental methods focus on measurement and analysis of thermally driven and wind-driven airflows, lighting intensity and glare, and heat flow and thermal storage. Experiments are conducted at model and full scale and are often motivated by ongoing field work in developing countries.
In this activity, learners burn a peanut, which produces a flame that …
In this activity, learners burn a peanut, which produces a flame that can be used to boil away water and count the calories contained in the peanut. Learners use a formula to calculate the calories in a peanut and then differentiate between food calories and physicist calories as well as calories and joules.
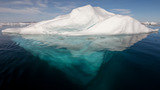
This article continues an examination of each of the seven essential principles …
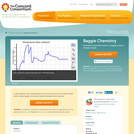
This article continues an examination of each of the seven essential principles of climate literacy on which the online magazine Beyond Weather and the Water Cycle is structured. Principle 2 covers the complex interactions among the components of the Earth system. The author discusses the scientific concepts underlying the interactions and expands the discussion with diagrams, photos, and online resources.
No restrictions on your remixing, redistributing, or making derivative works. Give credit to the author, as required.
Your remixing, redistributing, or making derivatives works comes with some restrictions, including how it is shared.
Your redistributing comes with some restrictions. Do not remix or make derivative works.
Most restrictive license type. Prohibits most uses, sharing, and any changes.
Copyrighted materials, available under Fair Use and the TEACH Act for US-based educators, or other custom arrangements. Go to the resource provider to see their individual restrictions.