The course treats the following topics: - Relevant physical oceanography - Elements …
The course treats the following topics: - Relevant physical oceanography - Elements of marine geology (seafloor topography, acoustical properties of sediments and rocks) - Underwater sound propagation (ray acoustics, ocean noise) - Interaction of sound with the seafloor (reflection, scattering) - Principles of sonar (beamforming) - Underwater acoustic mapping systems (single beam echo sounding, multi-beam echo sounding, sidescan sonar) - Data analysis (refraction corrections, digital terrain modelling) - Applications (hydrographic survey planning and navigation, coastal engineering) - Current and future developments.
This video segment adapted from NOVA uses microwave images to reveal how …
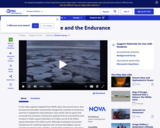
This video segment adapted from NOVA uses microwave images to reveal how sea ice doubles the size of Antarctica each winter. Rare footage shows how sea ice crushed the famous ship Endurance in 1914.
This video segment adapted from NASA's Goddard Space Flight Center describes El …
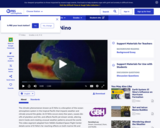
This video segment adapted from NASA's Goddard Space Flight Center describes El Niño, how it forms, and the chain reaction of consequences it triggers around the globe.
This course is an introduction to the fundamental aspects of science and …
This course is an introduction to the fundamental aspects of science and engineering necessary for exploring, observing, and utilizing the oceans. Hands-on projects focus on instrumentation in the marine environment and the design of ocean observatories for ocean monitoring and exploration. Topics include acoustics, sound speed and refraction, sounds generated by ships and marine animals, sonar systems and their principles of operation, hydrostatic behavior of floating and submerged bodies geared towards ocean vehicle design, stability of ocean vessels, and the application of instrumentation and electronics in the marine environment. Students work with sensor systems and deploy them in the field to gather and analyze real world data.
This book is written for upper-division undergraduates and new graduate students in …
This book is written for upper-division undergraduates and new graduate students in meteorology, ocean engineering, and oceanography. After reading this book, it expected that students will be able to describe physical processes influencing the ocean and coastal regions: the interaction of the ocean with the atmosphere, and the distribution of oceanic winds, currents, heat fluxes, and water masses.
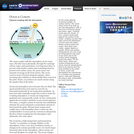
This experiment uses the heating of water to explore the concepts of …
This experiment uses the heating of water to explore the concepts of density and volume. Students learn about the transfer of heat energy within the atmosphere, hydrosphere, and Earth's interior, and connect this transfer to differences in density, which in turn result in motion. As part of the investigation, students will also become familiar with the Celsius and Fahrenheit temperature scales.
This page is part of NASA's Earth Observatory website. It features text …
This page is part of NASA's Earth Observatory website. It features text and a scientific illustration to describe how the ocean interacts with the atmosphere, physically exchanging heat, water, and momentum. It also includes links to related data sets, other ocean fact sheets, and relevant satellite missions.
This site provides fun activities for children to do and make, while …
This site provides fun activities for children to do and make, while they learn about space and Earth science, and the technology that enables science. The Teachers Corner on the WWW site contains curriculum supplements originally published in the ITEA (International Technology Education Association) Technology Transfer Teacher magazine.
In this exercise, students use online data, spreadsheets, and graphs to analyze …
In this exercise, students use online data, spreadsheets, and graphs to analyze tidal fluctuations at the Battery in New York. They will be asked to examine and compare the observed and predicted tides, and then make their own predictions.
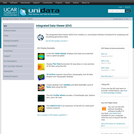
The Integrated Data Viewer (IDV) is a software framework for analyzing and …
The Integrated Data Viewer (IDV) is a software framework for analyzing and visualizing geoscience data sets collected by the Unidata Program. The IDV may be used to display and analyze satellite imagery, gridded data, surface observations, balloon soundings, radar data and more. Most of the data are provided in real time or near-real time. The IDV can display data anywhere on the globe with a wide selection of map projections and map backgrounds including a 3D spherical globe. Over 20 kinds of 2D and 3D data displays allow users to create cross-sections, profiles, animations and value read-outs of multi-dimensional data sets. A useful feature of the site is the ability to save displays in "bundle" files for use in classroom and lab exercises. Thorough and easy-to-follow directions for IDV installation and use are provided and annual training workshops are offered by Unidata. The data viewer is available for a free download, and data sets are available to participants who are affiliated with a degree-granting institution or a non-profit institution with an education and/or research mission. This resource is part of the Using Data collection. http://serc.carleton.edu/usingdata/
No restrictions on your remixing, redistributing, or making derivative works. Give credit to the author, as required.
Your remixing, redistributing, or making derivatives works comes with some restrictions, including how it is shared.
Your redistributing comes with some restrictions. Do not remix or make derivative works.
Most restrictive license type. Prohibits most uses, sharing, and any changes.
Copyrighted materials, available under Fair Use and the TEACH Act for US-based educators, or other custom arrangements. Go to the resource provider to see their individual restrictions.