Design challenge: Strong, light structures are necessary in constructing buildings (especially in …
Design challenge: Strong, light structures are necessary in constructing buildings (especially in areas with extreme weather) as well as air and space craft.
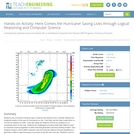
Students use a hurricane tracking map to measure the distance from a …
Students use a hurricane tracking map to measure the distance from a specific latitude and longitude location of the eye of a hurricane to a city. Then they use the map's scale factor to convert the distance to miles. They also apply the distance formula by creating an x-y coordinate plane on the map. Students are challenged to analyze what data might be used by computer science engineers to write code that generates hurricane tracking models. Then students analyze a MATLAB® computer code that uses the distance formula repetitively to generate a table of data that tracks a hurricane at specific time intervals. Students come to realize that using a computer program to generate the calculations (instead of by hand) is very advantageous for a dynamic situation like tracking storm movements. Their inspection of some MATLAB code helps them understand how it communicates what to do using mathematical formulas, logical instructions and repeated tasks. They also conclude that the example program is too simplistic to really be a useful tool; useful computer model tools must necessarily be much more complex.
Learning ObjectivesFlorida is situated in what is known as the "hurricane alley." …
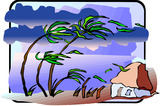
Learning ObjectivesFlorida is situated in what is known as the "hurricane alley." This region starts from the west coast of Africa to Florida, and up the Carolinas. This region is prone to tropical storms and hurricanes due to the warm water temperatures. The objective of this lesson is to offer tips and strategies without causing fear to elementary-level students so that students they can be prepared for the event of a hurricane ahead of time.
Students learn what causes hurricanes and what engineers do to help protect …
Students learn what causes hurricanes and what engineers do to help protect people from destruction caused by hurricane winds and rain. Research and data collection vessels allow for scientists and engineers to model and predict weather patterns and provide forecasts and storm warnings to the public. Engineers are also involved in the design and building of flood-prevention systems, such as levees and floodwalls. During the 2005 hurricane season, levees failed in the greater New Orleans area, contributing to the vast flooding and destruction of the historic city. In the associated activity, students learn how levees work, and they build their own levees and put them to the test!
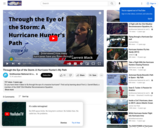
Do you have what it takes to fly through the eye of …
Do you have what it takes to fly through the eye of a massive hurricane? Find out by learning about First Lt. Garrett Black, a member of the USAF 53rd Weather Reconnaissance Squadron.
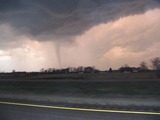
Students are introduced to our planet's structure and its dynamic system of …
Students are introduced to our planet's structure and its dynamic system of natural forces through an examination of the natural hazards of earthquakes, volcanoes, landslides, tsunamis, floods and tornados, as well as avalanches, fires, hurricanes and thunderstorms. They see how these natural events become disasters when they impact people, and how engineers help to make people safe from them. Students begin by learning about the structure of the Earth; they create clay models showing the Earth's layers, see a continental drift demo, calculate drift over time, and make fault models. They learn how earthquakes happen; they investigate the integrity of structural designs using model seismographs. Using toothpicks and mini-marshmallows, they create and test structures in a simulated earthquake on a tray of Jell-O. Students learn about the causes, composition and types of volcanoes, and watch and measure a class mock eruption demo, observing the phases that change a mountain's shape. Students learn that the different types of landslides are all are the result of gravity, friction and the materials involved. Using a small-scale model of a debris chute, they explore how landslides start in response to variables in material, slope and water content. Students learn about tsunamis, discovering what causes them and makes them so dangerous. Using a table-top-sized tsunami generator, they test how model structures of different material types fare in devastating waves. Students learn about the causes of floods, their benefits and potential for disaster. Using riverbed models made of clay in baking pans, students simulate the impact of different river volumes, floodplain terrain and levee designs in experimental trials. They learn about the basic characteristics, damage and occurrence of tornadoes, examining them closely by creating water vortices in soda bottles. They complete mock engineering analyses of tornado damage, analyze and graph US tornado damage data, and draw and present structure designs intended to withstand high winds.
Students are introduced to natural disasters, and learn the difference between natural …
Students are introduced to natural disasters, and learn the difference between natural hazards and natural disasters. They discover the many types of natural hazards avalanche, earthquake, flood, forest fire, hurricane, landslide, thunderstorm, tornado, tsunami and volcano as well as specific examples of natural disasters. Students also explore why understanding these natural events is important to engineers and everyone's survival on our planet.
Students design and build their own model levees. Acting as engineers for …
Students design and build their own model levees. Acting as engineers for their city, teams create sturdy barriers to prevent water from flooding a city in the event of a hurricane.
Have you ever wondered what happens inside the eye of a hurricane? …
Have you ever wondered what happens inside the eye of a hurricane? Find out what it's like and why it is important to study these storms from space, the ground, and in an airplane.
This course examines the science of natural catastrophes such as earthquakes and …
This course examines the science of natural catastrophes such as earthquakes and hurricanes and explores the relationships between the science of and policy toward such hazards. It presents the causes and effects of these phenomena, discusses their predictability, and examines how this knowledge influences policy making. This course includes intensive practice in the writing and presentation of scientific research and summaries for policy makers.
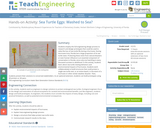
Students employ the full engineering design process to research and design prototypes …
Students employ the full engineering design process to research and design prototypes that could be used to solve the loss of sea turtle life during a hurricane. During Hurricane Irma, Florida lost a large proportion of its sea turtle nests. Protecting these nests from natural disasters or even human influence is an essential component of conservation in Florida, since only one hatchling in every thousand survives to adulthood. In this activity, students learn about sea turtle nesting behaviors and environmental impacts of hurricanes. Students work collaboratively to build structures that could protect a single sea turtle nest, or an entire beach, in the event of a hurricane or other similar weather disaster. Then, students present their solutions to concerned stakeholders. As an optional extension, students can build prototypes using 3D printers or 3D pens.
Students learn that wind and storms can form at the boundaries of …
Students learn that wind and storms can form at the boundaries of interacting high and low pressure air masses. They learn the distinguishing features of the four main types of weather fronts (warm fronts, cold fronts, stationary fronts and occluded fronts) and how those fronts are depicted on a surface weather analysis, or weather map. Students also learn several different ways that engineers help with storm prediction, analysis and protection.
This resource was created by Jason Smith, in collaboration with Lynn Bowder, as …
This resource was created by Jason Smith, in collaboration with Lynn Bowder, as part of ESU2's Mastering the Arts project. This project is a four year initiative focused on integrating arts into the core curriculum through teacher education and experiential learning.
This resource was created by Dave Privett, in collaboration with Lynn Bowder, …
This resource was created by Dave Privett, in collaboration with Lynn Bowder, as part of ESU2's Mastering the Arts project. This project is a four year initiative focused on integrating arts into the core curriculum through teacher education and experiential learning.
No restrictions on your remixing, redistributing, or making derivative works. Give credit to the author, as required.
Your remixing, redistributing, or making derivatives works comes with some restrictions, including how it is shared.
Your redistributing comes with some restrictions. Do not remix or make derivative works.
Most restrictive license type. Prohibits most uses, sharing, and any changes.
Copyrighted materials, available under Fair Use and the TEACH Act for US-based educators, or other custom arrangements. Go to the resource provider to see their individual restrictions.