This resource is a video abstract of a research paper created by …
This resource is a video abstract of a research paper created by Research Square on behalf of its authors. It provides a synopsis that's easy to understand, and can be used to introduce the topics it covers to students, researchers, and the general public. The video's transcript is also provided in full, with a portion provided below for preview:
"Attention-deficit/hyperactivity disorder (ADHD) affects 3-5% of the global population While diagnosis is an important first step to accessing proper care ADHD often goes undiagnosed or undertreated, including in the UK To understand why that might be, researchers interviewed general practitioners (GPs) and patients across the country The team discovered several barriers, including the sheer complexity of pathways to care lack of services limited GP recognition and knowledge of ADHD and communication difficulties among GPs and patients The findings suggest that GPs might be ill equipped to identify and manage ADHD in primary care And they highlight areas of improvement specific to the UK healthcare system For their part, the team has devised an educational resource to enhance understanding of ADHD, accessible at www.adhdinfo.org..."
The rest of the transcript, along with a link to the research itself, is available on the resource itself.
The class of CIVE230: Engineering and Sustainable Development have been at it …
The class of CIVE230: Engineering and Sustainable Development have been at it again, learning remotely in Spring 2021. This is the second COVID-19 edition of the course!The course introduces sustainability on two levels: qualitative concepts and background information is covered; and quantitative models which emphasize core engineering methods are applied to sustainability problems. Quantitative methods are derived and applied to air quality, water quality, energy and solid waste. Attention is given to sustainable urban systems, as they apply to both developed and developing countries. Sustainability concepts covering the triple bottom line are also presented, and their applicability to sustainable cities are demonstrated. Students in the course were tasked with making a contribution to an e-book. They were creative and innovative in applying course concepts to cities of their choice and exploring sustainability challenges and innovations. Their sustainability project encouraged them to explore sustainable infrastructure, solutions and technologies in Canada and globally to generate an enriched learning experience and to tie ideas to the Sustainable Development Goals (SDG) and the Canadian Engineering Grand Challenges (CEGC).
This course enhances cross-cultural understanding through the discussion of practical, ethical, and …
This course enhances cross-cultural understanding through the discussion of practical, ethical, and epistemological issues in conducting social science and applied research in foreign countries or unfamiliar communities. It includes a research practicum to help students develop interviewing, participant-observation, and other qualitative research skills, as well as critical discussion of case studies. The course is open to all interested students, but intended particularly for those planning to undertake exploratory research or applied work abroad. Students taking the graduate version complete additional assignments.
Learning about sustainability requires systems-thinking and a curiosity to explore. When learning …
Learning about sustainability requires systems-thinking and a curiosity to explore. When learning opportunities are created for students so that go beyond the course content by learning from the world around us and from each other, they get so much more out of the course. This e-book has been the project experience that allowed students to explore topics of their choice in cities of their choice!This e-book serves as a contribution by the class for the class, and for the wider UW and engineering community. Have a read through.
Students will be able to see how different communities throughout the world …
Students will be able to see how different communities throughout the world engage digitally. By understanding how different countries and cultures use digital media to engage socially, politically, educationally, and financially students will be able to see how communication is affected by access, infrastructure, and culture.
This is a free, online tool aiming to improve the competiveness of …
This is a free, online tool aiming to improve the competiveness of European Academic Spin-Offs and Start-ups by supporting them to effectively deal with the challenges faced when internationalising their businesses and to improve their global talent management. The programme is divided into three units, containing ten pillars each one, completed by a forth section of Success and Failure Cases about “Commercialization of new products and services abroad” and “Attracting and recruiting international high-qualified human capital”. Authors are the seven project partners:CCS Digital Education (Greece)University of Patras (Greece)Advancis Business Services, Lda. (Portugal)Vaasa University of Applied Sciences Finland)Promimpresa srl (Italy)Inova Consultancy (United Kindom)Fundación General Universidad de Granada Empresa (Spain)
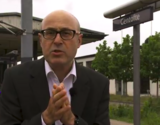
This video segment adapted from NOVA/FRONTLINE looks at the future of global …
This video segment adapted from NOVA/FRONTLINE looks at the future of global warming as developing nations, including India and China, increase their need for energy.
Is the hydrogen car the answer to global warming? This video segment …
Is the hydrogen car the answer to global warming? This video segment adapted from NOVA/FRONTLINE looks at the pros and cons of this developing technology.
This video segment adapted from NOVA/FRONTLINE examines the greenhouse effect, its role …
This video segment adapted from NOVA/FRONTLINE examines the greenhouse effect, its role in keeping Earth habitable, and the industrial changes that have led to an increase in the planet's average temperature.
Global Spin is a corporate learning programme aiming to improve the competiveness …
Global Spin is a corporate learning programme aiming to improve the competiveness of European Academic Spin-Offs and Start-ups by supporting them to effectively deal with the challenges faced when internationalising their businesses. The programme is divided into three units, containing ten pillars each one, completed by a forth section of Success and Failure Cases about “Commercialization of new products and services abroad” and “Attracting and recruiting international high-qualified human capital”.
The training programme has been developed in the framework of the Global-Spin Project: Transnational Entrepreneurship and Corporate Learning: Fostering Effective Internationalization Strategies in Academic Spin Offs, with the support of the European Union and the Erasmus+ Programme. The course’s contents are based on the knowledge, the experience and the researches carried out by the consortium, which is composed of Higher Education Foundation, two Universities and four companies specialized in consultancy, training and research. To know more about the project and the consortium’s partners, visit the website: https://globalspin.eu/ and the GLOBAL-SPIN - Transnational Entrepreneurs Forum: https://www.facebook.com/groups/1970586499822258/
Authors are the seven project partners:
CCS Digital Education (Greece) University of Patras (Greece) Advancis Business Services, Lda. (Portugal) Vaasa University of Applied Sciences Finland) Promimpresa srl (Italy) Inova Consultancy (United Kindom) Fundación General Universidad de Granada Empresa (Spain)
Below is a link to an interdisciplinary, tech-enriched Earth Day themed unit …
Below is a link to an interdisciplinary, tech-enriched Earth Day themed unit of study. The unit was designed for 3rd/4th-grade learners. The unit was designed to develop an understanding of important environmental issues so that students are more aware of the actions they can take to protect the Earth and environment. It was also planned with the intention of connecting concepts and ideas across multiple disciplines. This allows students to understand that topics can be interrelated regardless of subject matter. Teaching thematically helps deepen understanding by bringing ideas together to create more meaningful learning.This unit also strives to include technologies that do not simply act as substitutes for traditional activities. Instead, it attempts to integrate technologies that can modify and transform learning tasks into more meaningful, collaborative, and differentiated activities.https://docs.google.com/document/d/1RFtsd2UT-M7m8KKZ6Q-8HwU8aZvtkxwdJLVHBTZvM9U/edit?usp=sharingAuthors:Nick Tirozzi, Karen Frawley, Harry Bartlett, and Kristie Guevremont
This course examines the interconnections of international politics and climate change. Beginning …
This course examines the interconnections of international politics and climate change. Beginning with an analysis of the strategic and environmental legacies of the 20th Century, it explores the politicization of the natural environment, the role of science in this process, and the gradual shifts in political concerns to incorporate "nature". Two general thrusts of climate-politics connections are pursued, namely those related to (a) conflict – focusing on threats to security due to environmental dislocations and (b) cooperation – focusing on the politics of international treaties that have contributed to emergent processes for global accord in response to evidence of climate change. The course concludes by addressing the question of: "What Next?"
This course examines the interconnections of international politics and climate change. Beginning …
This course examines the interconnections of international politics and climate change. Beginning with an analysis of the strategic and environmental legacies of the 20th Century, it explores the politicization of the natural environment, the role of science in this process, and the gradual shifts in political concerns to incorporate "nature". Two general thrusts of climate-politics connections are pursued, namely those related to (a) conflict - focusing on threats to security due to environmental dislocations and (b) cooperation - focusing on the politics of international treaties that have contributed to emergent processes for global accord in response to evidence of climate change. The course concludes by addressing the question of: "What Next?
International Women’s Voices has several objectives. It introduces students to a variety …
International Women’s Voices has several objectives. It introduces students to a variety of works by contemporary women writers from Asia, Africa, the Middle East, Latin America and North America. The emphasis is on non-western writers. The readings are chosen to encourage students to think about how each author’s work reflects a distinct cultural heritage and to what extent, if any, we can identify a female voice that transcends national cultures. In lectures and readings distributed in class, students learn about the history and culture of each of the countries these authors represent. The way in which colonialism, religion, nation formation and language influence each writer is a major concern of this course. In addition, students examine the patterns of socialization of women in patriarchal cultures, and how, in the imaginary world, authors resolve or understand the relationship of the characters to love, work, identity, sex roles, marriage, and politics.
Course syllabus relies on library ebook, Shawn Smallman and Kimberley Brown’s Introduction …
Course syllabus relies on library ebook, Shawn Smallman and Kimberley Brown’s Introduction to International Studies, (University Of North Carolina Press, 2015).
Course Description: International Studies is a multidisciplinary study of the major geographical, political, economic, social and cultural issues that dominate the international agenda. This is an introductory course to international studies where the contemporary and historical relationship between countries and complex global forces are analyzed. Several global issues, such as migration, security, food, health, and climate are the major topics to study the increasing global interconnectedness and the political, economic, and cultural globalization.
At the end of this course: Students will acquire the foundational knowledge in the field of international studies. Students will demonstrate an ability to think globally and use multidisciplinary perspectives to analyze global phenomena. Students will be challenged to think critically about their own lives and their connection to other cultures, places and peoples in the world.
Infectious diseases have a specific, ethiological cause, e.g. a microbe such as …
Infectious diseases have a specific, ethiological cause, e.g. a microbe such as tuberculosis caused by Mycobacterium tuberculosis. However, most people exposed to TB does not develop the disease. What determines this may be poverty, weakening of the person by other diseases or smoking and alcohol. So-called life-style diseases are (also) determined by the way you live, and include prevalent non-communicable diseases such as type 2 diabetes and cardio-vascular diseases, but besides of risk factors such as smoking and drinking or over-eating, the living conditions matter equally and sometimes more. The environment, climate changes, urbanization, socio-economic factors all impact health and disease. When an individual grows older, patterns of his/her diseases changes: the same applies when a society grows ‘older’.
Previously infectious diseases previously caused the majority of ill-health and premature death …
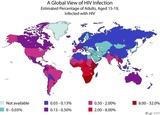
Previously infectious diseases previously caused the majority of ill-health and premature death globally, but in high- and middle-income countries during the 20.th century infectious diseases – with the exception of HIV – declined. Introduction of hygiene and discovery of microbes and later vaccines an antibiotics contributed to the decline, but changing living conditions with better housing, nutrition, water and sanitation were the main drivers of infectious diseases’ decline.
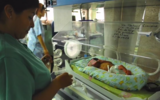
This presentation provides an introduction to the principles of demographic and epidemiological …
This presentation provides an introduction to the principles of demographic and epidemiological transition with specific focus on how changes in life expectancy, socio-economic factors and life conditions will change the landscape of global disease burdens.
No restrictions on your remixing, redistributing, or making derivative works. Give credit to the author, as required.
Your remixing, redistributing, or making derivatives works comes with some restrictions, including how it is shared.
Your redistributing comes with some restrictions. Do not remix or make derivative works.
Most restrictive license type. Prohibits most uses, sharing, and any changes.
Copyrighted materials, available under Fair Use and the TEACH Act for US-based educators, or other custom arrangements. Go to the resource provider to see their individual restrictions.