Students will use the Census Business Builder: Small Business Edition data access …
Students will use the Census Business Builder: Small Business Edition data access tool to gather and analyze information that entrepreneurs may consider when opening a business. This introductory activity assumes that students have limited experience using data access tools.
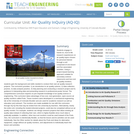
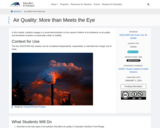
Students engage in hands-on, true-to-life research experiences on air quality topics chosen …
Students engage in hands-on, true-to-life research experiences on air quality topics chosen for personal interest through a unit composed of one lesson and five associated activities. Using a project-based learning approach suitable for secondary science classrooms and low-cost air quality monitors, students gain the background and skills needed to conduct their own air quality research projects. The curriculum provides: 1) an introduction to air quality science, 2) data collection practice, 3) data analysis practice, 4) help planning and conducting a research project and 5) guidance in interpreting data and presenting research in professional poster format. The comprehensive curriculum requires no pre-requisite knowledge of air quality science or engineering. This curriculum takes advantage of low-cost, next-generation, open-source air quality monitors called Pods. These monitors were developed in a mechanical engineering lab at the University of Colorado Boulder and are used for academic research as well as education and outreach. The monitors are made available for use with this curriculum through AQ-IQ Kits that may be rented from the university by teachers. Alternatively, nearly the entire unit, including the student-directed projects, could also be completed without an air quality monitor. For example, students can design research projects that utilize existing air quality data instead of collecting their own, which is highly feasible since much data is publically available. In addition, other low-cost monitors could be used instead of the Pods. Also, the curriculum is intentionally flexible, so that the lesson and its activities can be used individually. See the Other section for details about the Pods and ideas for alternative equipment, usage without air quality monitors, and adjustments to individually teach the lesson and activities.
In this module, students engage in a visual demonstration on the causes …
In this module, students engage in a visual demonstration on the causes & effects of air pollutants on air quality and kinesthetic activities on particulate matter & visibility.
Students will look at data showing how the “millennial” generation differs from …
Students will look at data showing how the “millennial” generation differs from other generations. They will analyze and evaluate social changes evident in the data. Then they will work with a partner to compose a newsletter.
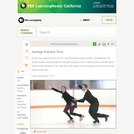
Students will explore maps containing census data from 1950 through 2000. They …
Students will explore maps containing census data from 1950 through 2000. They will analyze how education levels and median household incomes have changed over time and determine how the two might be correlated. Students will also come up with ideas for policies that could help address issues related to income and education.
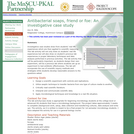
Intermediate students are asked to analyze data on the components of consumption …
Intermediate students are asked to analyze data on the components of consumption and investment expenditures and explanatory variables based on textbook models of each. Students look for rough correlations between the explanatory and dependent variables.
Students prepare for the associated activity in which they investigate acceleration by …
Students prepare for the associated activity in which they investigate acceleration by collecting acceleration vs. time data using the accelerometer of a sliding Android device. Based on the experimental set-up for the activity, students form hypotheses about the acceleration of the device. Students will investigate how the force on the device changes according to Newton's Second Law. Different types of acceleration, including average, instantaneous and constant acceleration, are introduced. Acceleration and force is described mathematically and in terms of processes and applications.
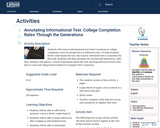
Students will read an informational text about variations in college completion rates …
Students will read an informational text about variations in college completion rates for people born in different years. To help students better understand the text, the teacher will model how to annotate the first half. Students will then annotate the second half themselves. After that, students will answer a series of questions about the text, drawing inferences from what they’ve read and citing textual evidence to support their responses.
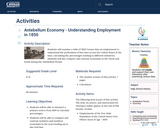
Students will examine a table of 1850 Census data on employment to …
Students will examine a table of 1850 Census data on employment to understand the professions of free men across the United States at the time, calculating the percentages working in different industries. Students will also compare and contrast economies in the North and South during the Antebellum Period.
This lab activity will not only draw on students' real life experiences …
This lab activity will not only draw on students' real life experiences but will also draw on student's previous lab experiences in proper laboratory techniques and data analysis performed in previous activities. The lab will incorporate the use of scientific inquiry methods and strategies while students develop reasonable answers to the questions asked.
Students will use state and regional unemployment data for various education levels …
Students will use state and regional unemployment data for various education levels to create scatter plots and calculate correlation coefficients. Students will then compare scatter plots with different strengths of linear relationships and will determine the impact of any influential points on the correlation coefficient.
Measuring the dimensions of nano-circuits requires an expensive, high-resolution microscope with integrated …
Measuring the dimensions of nano-circuits requires an expensive, high-resolution microscope with integrated video camera and a computer with sophisticated imaging software, but in this activity, students measure nano-circuits using a typical classroom computer and (the free-to-download) GeoGebra geometry software. Inserting (provided) circuit pictures from a high-resolution microscope as backgrounds in GeoGebra's graphing window, students use the application's tools to measure lengths and widths of circuit elements. To simplify the conversion from the on-screen units to the real circuits' units and the manipulation of the pictures, a GeoGebra measuring interface is provided. Students export their data from GeoGebra to Microsoft® Excel® for graphing and analysis. They test the statistical significance of the difference in circuit dimensions, as well as obtain a correlation between average changes in original vs. printed circuits' widths. This activity and its associated lesson are suitable for use during the last six weeks of the AP Statistics course; see the topics and timing note below for details.
Students will use images, U.S. Census Bureau data, and interactive maps to …
Students will use images, U.S. Census Bureau data, and interactive maps to visualize and calculate arithmetic (population), agricultural, and physiological densities at local, regional, and national scales. They will also transfer their calculations to bar graphs.
Students act as R&D entrepreneurs, learning ways to research variables affecting the …
Students act as R&D entrepreneurs, learning ways to research variables affecting the market of their proposed (hypothetical) products. They learn how to obtain numeric data using a variety of Internet tools and resources, sort and analyze the data using Excel and other software, and discover patterns and relationships that influence and guide decisions related to launching their products. First, student pairs research and collect pertinent consumer data, importing the data into spreadsheets. Then they clean, organize, chart and analyze the data to inform their product production and marketing plans. They calculate related statistics and gain proficiency in obtaining and finding relationships between variables, which is important in the work of engineers as well as for general technical literacy and decision-making. They summarize their work by suggesting product launch strategies and reporting their findings and conclusions in class presentations. A finding data tips handout, project/presentation grading rubric and alternative self-guided activity worksheet are provided. This activity is ideal for a high school statistics class.
Students act as if they are biological engineers following the steps of …
Students act as if they are biological engineers following the steps of the engineering design process to design and create protein models to replace the defective proteins in a child’s body. Jumping off from a basic understanding of DNA and its transcription and translation processes, students learn about the many different proteins types and what happens if protein mutations occur. Then they focus on structural, transport and defense proteins during three challenges posed by the R&D; bio-engineering hypothetical scenario. Using common classroom supplies such as paper, tape and craft sticks, student pairs design, sketch, build, test and improve their own protein models to meet specific functional requirements: to strengthen bones (collagen), to capture oxygen molecules (hemoglobin) and to capture bacteria (antibody). By designing and testing physical models to accomplish certain functional requirements, students come to understand the relationship between protein structure and function. They graph and analyze the class data, then share and compare results across all teams to determine which models were the most successful. Includes a quiz, three worksheets and a reference sheet.
The aim of this course is to provide fundamental statistical concepts and …
The aim of this course is to provide fundamental statistical concepts and tools relevant to the practice of summarizing, analyzing, and visualizing data. This course will build your knowledge of the fundamental principles of biostatistical inference. The course will focus on linear regression and generalized linear regression models. We will use a variety of examples and exercises from scientific, medical, and public health research.
No restrictions on your remixing, redistributing, or making derivative works. Give credit to the author, as required.
Your remixing, redistributing, or making derivatives works comes with some restrictions, including how it is shared.
Your redistributing comes with some restrictions. Do not remix or make derivative works.
Most restrictive license type. Prohibits most uses, sharing, and any changes.
Copyrighted materials, available under Fair Use and the TEACH Act for US-based educators, or other custom arrangements. Go to the resource provider to see their individual restrictions.