Phase 1: Definition of Projects and Research Teams (Homework +1 Class)
Each student is assigned the task of proposing a site to investigate within the city and the surrounding region. Students are encouraged to discuss the assignment with community members for suggestions and inspiration. Each student will produce an easel-size poster of their proposal highlighting the following:
Site location;
Reasons for selecting this site;
Potential interest to the community;
Potential logistical problems associated with the proposed site/project.
Posters will be hung in a gallery-walk format, and each student will mark the location of their proposed study site on the classroom map of New York City. The class is given time to read and comment on each of their peers' proposals, after which the instructor will lead a class discussion of the interests, merits, and obstacles associated with each proposal, with the goal of having the class settle on the set of projects on which to move forward.
Students will define groups of 2 to 4 students per project. If more than 4 students are interested in the same site, then multiple groups may develop parallel projects.
Phase 2: Data Collection and Analysis (5 weeks)
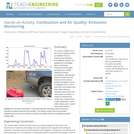
In consultation with the instructor, teams develop and implement a sampling protocol, including the documentation of terrain, human activity, and weather conditions (wind speed and direction) at the time of collection. Sample stations and prevailing wind direction are plotted on Google Earth to determine likely sources of particulates. Using binocular microscopes students document size distribution, form, color, and abundance of particulates. This data is analyzed using statistical functions in Excel. Teams use SEM-EDS analysis to determine the composition of particles, and more fully describe their form. Teams submit weekly progress reports, including personal work reports for each team member.
Phase 3: Communication of Results (1 Week)
Teams submit to their instructor a formal laboratory report: Purpose, Equipment, Method, Data Tabulation, Data Analysis, and Conclusions.
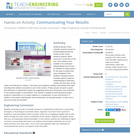
Teams prepare an oral presentation, or visual information campaign, targeted at an audience of their choice (e.g., neighbors, church group, community activist group, college administration) using discourse appropriate to that audience. Teams present in an in-class dress-rehearsal prior to their formal presentation. Teams invite members of their desired audience to the presentation (official invitations sent). On the last day of class, the instructor leads a debriefing and critique of the presentations, highlighting results and effective communication techniques.
(Note: this resource was added to OER Commons as part of a batch upload of over 2,200 records. If you notice an issue with the quality of the metadata, please let us know by using the 'report' button and we will flag it for consideration.)