Biology is designed for multi-semester biology courses for science majors. It is …
Biology is designed for multi-semester biology courses for science majors. It is grounded on an evolutionary basis and includes exciting features that highlight careers in the biological sciences and everyday applications of the concepts at hand. To meet the needs of today’s instructors and students, some content has been strategically condensed while maintaining the overall scope and coverage of traditional texts for this course. Instructors can customize the book, adapting it to the approach that works best in their classroom. Biology also includes an innovative art program that incorporates critical thinking and clicker questions to help students understand—and apply—key concepts.
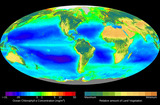
By the end of this section, you will be able to:Explain how …
By the end of this section, you will be able to:Explain how plants absorb energy from sunlightDescribe short and long wavelengths of lightDescribe how and where photosynthesis takes place within a plant
By the end of this section, you will be able to:Explain how …
By the end of this section, you will be able to:Explain how plants absorb energy from sunlightDescribe short and long wavelengths of lightDescribe how and where photosynthesis takes place within a plant
Students create and decorate their own spectrographs using simple materials and holographic …
Students create and decorate their own spectrographs using simple materials and holographic diffraction gratings. A holographic diffraction grating acts like a prism, showing the visual components of light. After building the spectrographs, students observe the spectra of different light sources as homework.
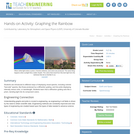
This course introduces principles and technologies for converting heat into electricity via …
This course introduces principles and technologies for converting heat into electricity via solid-state devices. The first part of the course discusses thermoelectric energy conversion and thermoelectric materials, thermionic energy conversion, and photovoltaics. The second part of the course discusses solar thermal technologies. Various solar heat collection systems will be reviewed, followed by an introduction to the principles of solar thermophotovoltaics and solar thermoelectrics. Spectral control techniques, which are critical for solar thermal systems, will be discussed.
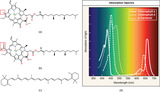
Students are introduced to different ways of displaying visual spectra, including colored …
Students are introduced to different ways of displaying visual spectra, including colored "barcode" spectra, like those produced by a diffraction grating, and line plots displaying intensity versus color, or wavelength. Students learn that a diffraction grating acts like a prism, bending light into its component colors.
Students use the spectrographs from the "Building a Fancy Spectrograph" activity to …
Students use the spectrographs from the "Building a Fancy Spectrograph" activity to gather data about light sources. Using their data, they make comparisons between different light sources and make conjectures about the composition of a mystery light source.
Students use the spectrograph from the "Building a Fancy Spectrograph" activity to …
Students use the spectrograph from the "Building a Fancy Spectrograph" activity to gather data about different light sources. Using the data, they make comparisons between the light sources and make conjectures about the composition of these sources.
No restrictions on your remixing, redistributing, or making derivative works. Give credit to the author, as required.
Your remixing, redistributing, or making derivatives works comes with some restrictions, including how it is shared.
Your redistributing comes with some restrictions. Do not remix or make derivative works.
Most restrictive license type. Prohibits most uses, sharing, and any changes.
Copyrighted materials, available under Fair Use and the TEACH Act for US-based educators, or other custom arrangements. Go to the resource provider to see their individual restrictions.