All resources in Educators

Introduction to Geospatial Raster and Vector Data with R

(View Complete Item Description)

Data Carpentry lesson to open, work with, and plot vector and raster-format spatial data in R. The episodes in this lesson cover how to open, work with, and plot vector and raster-format spatial data in R. Additional topics include working with spatial metadata (extent and coordinate reference systems), reprojecting spatial data, and working with raster time series data.

Material Type: Module

Authors: Ana Costa Conrado, Angela Li, Anne Fouilloux, Brett Lord-Castillo, Ethan P White, Joseph Stachelek, Juan F Fung, Katrin Leinweber, Klaus Schliep, Kristina Riemer, Lachlan Deer, Lauren O'Brien, Marchand, Punam Amratia, Sergio Marconi, Stéphane Guillou, Tracy Teal, zenobieg

Introduction to Geospatial Concepts

(View Complete Item Description)

Data Carpentry lesson to understand data structures and common storage and transfer formats for spatial data. The goal of this lesson is to provide an introduction to core geospatial data concepts. It is intended for learners who have no prior experience working with geospatial data, and as a pre-requisite for the R for Raster and Vector Data lesson . This lesson can be taught in approximately 75 minutes and covers the following topics: Introduction to raster and vector data format and attributes Examples of data types commonly stored in raster vs vector format Introduction to categorical vs continuous raster data and multi-layer rasters Introduction to the file types and R packages used in the remainder of this workshop Introduction to coordinate reference systems and the PROJ4 format Overview of commonly used programs and applications for working with geospatial data The Introduction to R for Geospatial Data lesson provides an introduction to the R programming language while the R for Raster and Vector Data lesson provides a more in-depth introduction to visualization (focusing on geospatial data), and working with data structures unique to geospatial data. The R for Raster and Vector Data lesson assumes that learners are already familiar with both geospatial data concepts and the core concepts of the R language.

Material Type: Module

Authors: Anne Fouilloux, Chris Prener, Dev Paudel, Ethan P White, Joseph Stachelek, Katrin Leinweber, Lauren O'Brien, Michael Koontz, Paul Miller, Tracy Teal, Whalen

Análisis y visualización de datos usando Python

(View Complete Item Description)

Python es un lenguaje de programación general que es útil para escribir scripts para trabajar con datos de manera efectiva y reproducible. Esta es una introducción a Python diseñada para participantes sin experiencia en programación. Estas lecciones pueden enseñarse en un día (~ 6 horas). Las lecciones empiezan con información básica sobre la sintaxis de Python, la interface de Jupyter Notebook, y continúan con cómo importar archivos CSV, usando el paquete Pandas para trabajar con DataFrames, cómo calcular la información resumen de un DataFrame, y una breve introducción en cómo crear visualizaciones. La última lección demuestra cómo trabajar con bases de datos directamente desde Python. Nota: los datos no han sido traducidos de la versión original en inglés, por lo que los nombres de variables se mantienen en inglés y los números de cada observación usan la sintaxis de habla inglesa (coma separador de miles y punto separador de decimales).

Material Type: Module

Authors: Alejandra Gonzalez-Beltran, April Wright, chekos, Christopher Erdmann, Enric Escorsa O'Callaghan, Erin Becker, Fernando Garcia, Hely Salgado, Juan Martín Barrios, Juan M. Barrios, Katrin Leinweber, Laura Angelone, Leonardo Ulises Spairani, LUS24, Maxim Belkin, Miguel González, monialo2000, Nicolás Palopoli, Nohemi Huanca Nunez, Paula Andrea Martinez, Raniere Silva, Rayna Harris, rzayas, Sarah Brown, Silvana Pereyra, Spencer Harris, Stephan Druskat, Trevor Keller, Wilson Lozano

Introduction to R for Geospatial Data

(View Complete Item Description)

The goal of this lesson is to provide an introduction to R for learners working with geospatial data. It is intended as a pre-requisite for the R for Raster and Vector Data lesson for learners who have no prior experience using R. This lesson can be taught in approximately 4 hours and covers the following topics: Working with R in the RStudio GUI Project management and file organization Importing data into R Introduction to R’s core data types and data structures Manipulation of data frames (tabular data) in R Introduction to visualization Writing data to a file The the R for Raster and Vector Data lesson provides a more in-depth introduction to visualization (focusing on geospatial data), and working with data structures unique to geospatial data.

Material Type: Module

Authors: Anne Fouilloux, butterflyskip, Chris Prener, Claudia Engel, David Mawdsley, Erin Becker, François Michonneau, Ido Bar, Jeffrey Oliver, Juan Fung, Katrin Leinweber, Kevin Weitemier, Kok Ben Toh, Lachlan Deer, Marieke Frassl, Matt Clark, Miles McBain, Naupaka Zimmerman, Paula Andrea Martinez, Preethy Nair, Raniere Silva, Rayna Harris, Richard McCosh, Vicken Hillis

R para Análisis Científicos Reproducibles

(View Complete Item Description)

Una introducción a R utilizando los datos de Gapminder. El objetivo de esta lección es enseñar a las programadoras principiantes a escribir códigos modulares y adoptar buenas prácticas en el uso de R para el análisis de datos. R nos provee un conjunto de paquetes desarrollados por terceros que se usan comúnmente en diversas disciplinas científicas para el análisis estadístico. Encontramos que muchos científicos que asisten a los talleres de Software Carpentry utilizan R y quieren aprender más. Nuestros materiales son relevantes ya que proporcionan a los asistentes una base sólida en los fundamentos de R y enseñan las mejores prácticas del cómputo científico: desglose del análisis en módulos, automatización tareas y encapsulamiento. Ten en cuenta que este taller se enfoca en los fundamentos del lenguaje de programación R y no en el análisis estadístico. A lo largo de este taller se utilizan una variedad de paquetes desarrolados por terceros, los cuales no son necesariamente los mejores ni se encuentran explicadas todas sus funcionalidades, pero son paquetes que consideramos útiles y han sido elegidos principalmente por su facilidad de uso.

Material Type: Module

Authors: 0xgc, Alejandra Gonzalez-Beltran, Ana Beatriz Villaseñor Altamirano, Antonio, AntonioJBT, A. s, Belinda Weaver, Claudia Engel, Cynthia Monastirsky, Daniel Beiter, David Mawdsley, David Pérez-Suárez, Erin Becker, EuniceML, François Michonneau, Gordon McDonald, Guillermina Actis, Guillermo Movia, Hely Salgado, Ido Bar, Ivan Ogasawara, Ivonne Lujano, James J Balamuta, Jamie McDevitt-Irwin, Jeff Oliver, Jonah Duckles, Juan M. Barrios, juli arancio, Katrin Leinweber, Kevin Alquicira, Kevin Martínez-Folgar, Laura Angelone, Laura-Gomez, Leticia Vega, Marcela Alfaro Córdoba, Marceline Abadeer, Maria Florencia D'Andrea, Marie-Helene Burle, Marieke Frassl, Matias Andina, Murray Cadzow, Narayanan Raghupathy, Naupaka Zimmerman, Paola Prieto, Paula Andrea Martinez, Raniere Silva, raynamharris, Rayna M Harris, Richard Barnes, Richard McCosh, Romualdo Zayas-Lagunas, Sandra Brosda, Sasha Lavrentovich, saynomoregrl, Shirley Alquicira Hernandez, Silvana Pereyra, Tobin Magle, Veronica Jimenez

OpenRefine for Social Science Data

(View Complete Item Description)

Lesson on OpenRefine for social scientists. A part of the data workflow is preparing the data for analysis. Some of this involves data cleaning, where errors in the data are identifed and corrected or formatting made consistent. This step must be taken with the same care and attention to reproducibility as the analysis. OpenRefine (formerly Google Refine) is a powerful free and open source tool for working with messy data: cleaning it and transforming it from one format into another. This lesson will teach you to use OpenRefine to effectively clean and format data and automatically track any changes that you make. Many people comment that this tool saves them literally months of work trying to make these edits by hand.

Material Type: Module

Authors: Erin Becker, François Michonneau, Geoff LaFlair, Karen Word, Lachlan Deer, Peter Smyth, Tracy Teal

Data Organization in Spreadsheets for Social Scientists

(View Complete Item Description)

Lesson on spreadsheets for social scientists. Good data organization is the foundation of any research project. Most researchers have data in spreadsheets, so it’s the place that many research projects start. Typically we organize data in spreadsheets in ways that we as humans want to work with the data. However computers require data to be organized in particular ways. In order to use tools that make computation more efficient, such as programming languages like R or Python, we need to structure our data the way that computers need the data. Since this is where most research projects start, this is where we want to start too! In this lesson, you will learn: Good data entry practices - formatting data tables in spreadsheets How to avoid common formatting mistakes Approaches for handling dates in spreadsheets Basic quality control and data manipulation in spreadsheets Exporting data from spreadsheets In this lesson, however, you will not learn about data analysis with spreadsheets. Much of your time as a researcher will be spent in the initial ‘data wrangling’ stage, where you need to organize the data to perform a proper analysis later. It’s not the most fun, but it is necessary. In this lesson you will learn how to think about data organization and some practices for more effective data wrangling. With this approach you can better format current data and plan new data collection so less data wrangling is needed.

Material Type: Module

Authors: David Mawdsley, Erin Becker, François Michonneau, Karen Word, Lachlan Deer, Peter Smyth

La Terminal de Unix

(View Complete Item Description)

Software Carpentry lección para la terminal de Unix La terminal de Unix ha existido por más tiempo que la mayoría de sus usuarios. Ha sobrevivido tanto tiempo porque es una herramienta poderosa que permite a las personas hacer cosas complejas con sólo unas pocas teclas. Lo más importante es que ayuda a combinar programas existentes de nuevas maneras y automatizar tareas repetitivas, en vez de estar escribiendo las mismas cosas una y otra vez. El uso del terminal o shell es fundamental para usar muchas otras herramientas poderosas y recursos informáticos (incluidos los supercomputadores o “computación de alto rendimiento”). Esta lección te guiará en el camino hacia el uso eficaz de estos recursos.

Material Type: Module

Authors: Adam Huffman, Alejandra Gonzalez-Beltran, AnaBVA, Andrew Sanchez, Anja Le Blanc, Ashwin Srinath, Brian Ballsun-Stanton, Colin Morris, csqrs, Dani Ledezma, Dave Bridges, Erin Becker, Francisco Palm, François Michonneau, Gabriel A. Devenyi, Gerard Capes, Giuseppe Profiti, Gordon Rhea, Jake Cowper Szamosi, Jared Flater, Jeff Oliver, Jonah Duckles, Juan M. Barrios, Katrin Leinweber, Kelly L. Rowland, Kevin Alquicira, Kunal Marwaha, LauCIFASIS, Marisa Lim, Martha Robinson, Matias Andina, Michael Zingale, Nicolas Barral, Nohemi Huanca Nunez, Olemis Lang, Otoniel Maya, Paula Andrea Martinez, Raniere Silva, Rayna M Harris, Shirley Alquicira, Silvana Pereyra, sjnair, Stéphane Guillou, Steve Leak, Thomas Mellan, Veronica Jimenez-Jacinto, William L. Close, Yee Mey

El Control de Versiones con Git

(View Complete Item Description)

Software Carpentry lección para control de versiones con Git Para ilustrar el poder de Git y GitHub, usaremos la siguiente historia como un ejemplo motivador a través de esta lección. El Hombre Lobo y Drácula han sido contratados por Universal Missions para investigar si es posible enviar su próximo explorador planetario a Marte. Ellos quieren poder trabajar al mismo tiempo en los planes, pero ya han experimentado ciertos problemas anteriormente al hacer algo similar. Si se rotan por turnos entonces cada uno gastará mucho tiempo esperando a que el otro termine, pero si trabajan en sus propias copias e intercambian los cambios por email, las cosas se perderán, se sobreescribirán o se duplicarán. Un colega sugiere utilizar control de versiones para lidiar con el trabajo. El control de versiones es mejor que el intercambio de ficheros por email: Nada se pierde una vez que se incluye bajo control de versiones, a no ser que se haga un esfuerzo sustancial. Como se van guardando todas las versiones precedentes de los ficheros, siempre es posible volver atrás en el tiempo y ver exactamente quién escribió qué en un día en particular, o qué versión de un programa fue utilizada para generar un conjunto de resultados en particular. Como se tienen estos registros de quién hizo qué y en qué momento, es posible saber a quién preguntar si se tiene una pregunta en un momento posterior y, si es necesario, revertir el contenido a una versión anterior, de forma similar a como funciona el comando “deshacer” de los editores de texto. Cuando varias personas colaboran en el mismo proyecto, es posible pasar por alto o sobreescribir de manera accidental los cambios hechos por otra persona. El sistema de control de versiones notifica automáticamente a los usuarios cada vez que hay un conflicto entre el trabajo de una persona y la otra. Los equipos no son los únicos que se benefician del control de versiones: los investigadores independientes se pueden beneficiar en gran medida. Mantener un registro de qué ha cambiado, cuándo y por qué es extremadamente útil para todos los investigadores si alguna vez necesitan retomar el proyecto en un momento posterior (e.g. un año después, cuando se ha desvanecido el recuerdo de los detalles).

Material Type: Module

Authors: Alejandra Gonzalez-Beltran, Amy Olex, Belinda Weaver, Bradford Condon, butterflyskip, Casey Youngflesh, Daisie Huang, Dani Ledezma, dounia, Francisco Palm, Garrett Bachant, Heather Nunn, Hely Salgado, Ian Lee, Ivan Gonzalez, James E McClure, Javier Forment, Jimmy O'Donnell, Jonah Duckles, Katherine Koziar, Katrin Leinweber, K.E. Koziar, Kevin Alquicira, Kevin MF, Kurt Glaesemann, LauCIFASIS, Leticia Vega, Lex Nederbragt, Mark Woodbridge, Matias Andina, Matt Critchlow, Mingsheng Zhang, Nelly Sélem, Nima Hejazi, Nohemi Huanca Nunez, Olemis Lang, Paula Andrea Martinez, Peace Ossom Williamson, P. L. Lim, Rayna M Harris, Romualdo Zayas-Lagunas, Sarah Stevens, Saskia Hiltemann, Shirley Alquicira, Silvana Pereyra, Tom Morrell, Valentina Bonetti, Veronica Ikeshoji-Orlati, Veronica Jimenez

Data Organization in Spreadsheets for Ecologists

(View Complete Item Description)

Good data organization is the foundation of any research project. Most researchers have data in spreadsheets, so it’s the place that many research projects start. We organize data in spreadsheets in the ways that we as humans want to work with the data, but computers require that data be organized in particular ways. In order to use tools that make computation more efficient, such as programming languages like R or Python, we need to structure our data the way that computers need the data. Since this is where most research projects start, this is where we want to start too! In this lesson, you will learn: Good data entry practices - formatting data tables in spreadsheets How to avoid common formatting mistakes Approaches for handling dates in spreadsheets Basic quality control and data manipulation in spreadsheets Exporting data from spreadsheets In this lesson, however, you will not learn about data analysis with spreadsheets. Much of your time as a researcher will be spent in the initial ‘data wrangling’ stage, where you need to organize the data to perform a proper analysis later. It’s not the most fun, but it is necessary. In this lesson you will learn how to think about data organization and some practices for more effective data wrangling. With this approach you can better format current data and plan new data collection so less data wrangling is needed.

Material Type: Module

Authors: Christie Bahlai, Peter R. Hoyt, Tracy Teal

Data Cleaning with OpenRefine for Ecologists

(View Complete Item Description)

A part of the data workflow is preparing the data for analysis. Some of this involves data cleaning, where errors in the data are identified and corrected or formatting made consistent. This step must be taken with the same care and attention to reproducibility as the analysis. OpenRefine (formerly Google Refine) is a powerful free and open source tool for working with messy data: cleaning it and transforming it from one format into another. This lesson will teach you to use OpenRefine to effectively clean and format data and automatically track any changes that you make. Many people comment that this tool saves them literally months of work trying to make these edits by hand.

Material Type: Module

Authors: Cam Macdonell, Deborah Paul, Phillip Doehle, Rachel Lombardi

Data Management with SQL for Ecologists

(View Complete Item Description)

Databases are useful for both storing and using data effectively. Using a relational database serves several purposes. It keeps your data separate from your analysis. This means there’s no risk of accidentally changing data when you analyze it. If we get new data we can rerun a query to find all the data that meets certain criteria. It’s fast, even for large amounts of data. It improves quality control of data entry (type constraints and use of forms in Access, Filemaker, etc.) The concepts of relational database querying are core to understanding how to do similar things using programming languages such as R or Python. This lesson will teach you what relational databases are, how you can load data into them and how you can query databases to extract just the information that you need.

Material Type: Module

Authors: Christina Koch, Donal Heidenblad, Katy Felkner, Rémi Rampin, Timothée Poisot

Data Analysis and Visualization in R for Ecologists

(View Complete Item Description)

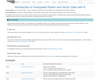
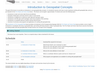
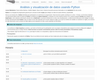
Data Carpentry lesson from Ecology curriculum to learn how to analyse and visualise ecological data in R. Data Carpentry’s aim is to teach researchers basic concepts, skills, and tools for working with data so that they can get more done in less time, and with less pain. The lessons below were designed for those interested in working with ecology data in R. This is an introduction to R designed for participants with no programming experience. These lessons can be taught in a day (~ 6 hours). They start with some basic information about R syntax, the RStudio interface, and move through how to import CSV files, the structure of data frames, how to deal with factors, how to add/remove rows and columns, how to calculate summary statistics from a data frame, and a brief introduction to plotting. The last lesson demonstrates how to work with databases directly from R.

Material Type: Module

Authors: Ankenbrand, Markus, Arindam Basu, Ashander, Jaime, Bahlai, Christie, Bailey, Alistair, Becker, Erin Alison, Bledsoe, Ellen, Boehm, Fred, Bolker, Ben, Bouquin, Daina, Burge, Olivia Rata, Burle, Marie-Helene, Carchedi, Nick, Chatzidimitriou, Kyriakos, Chiapello, Marco, Conrado, Ana Costa, Cortijo, Sandra, Cranston, Karen, Cuesta, Sergio Martínez, Culshaw-Maurer, Michael, Czapanskiy, Max, Daijiang Li, Dashnow, Harriet, Daskalova, Gergana, Deer, Lachlan, Direk, Kenan, Dunic, Jillian, Elahi, Robin, Fishman, Dmytro, Fouilloux, Anne, Fournier, Auriel, Gan, Emilia, Goswami, Shubhang, Guillou, Stéphane, Hancock, Stacey, Hardenberg, Achaz Von, Harrison, Paul, Hart, Ted, Herr, Joshua R., Hertweck, Kate, Hodges, Toby, Hulshof, Catherine, Humburg, Peter, Jean, Martin, Johnson, Carolina, Johnson, Kayla, Johnston, Myfanwy, Jordan, Kari L, K. A. S. Mislan, Kaupp, Jake, Keane, Jonathan, Kerchner, Dan, Klinges, David, Koontz, Michael, Leinweber, Katrin, Lepore, Mauro Luciano, Lijnzaad, Philip, Li, Ye, Lotterhos, Katie, Mannheimer, Sara, Marwick, Ben, Michonneau, François, Millar, Justin, Moreno, Melissa, Najko Jahn, Obeng, Adam, Odom, Gabriel J., Pauloo, Richard, Pawlik, Aleksandra Natalia, Pearse, Will, Peck, Kayla, Pederson, Steve, Peek, Ryan, Pletzer, Alex, Quinn, Danielle, Rajeg, Gede Primahadi Wijaya, Reiter, Taylor, Rodriguez-Sanchez, Francisco, Sandmann, Thomas, Seok, Brian, Sfn_brt, Shiklomanov, Alexey, Shivshankar Umashankar, Stachelek, Joseph, Strauss, Eli, Sumedh, Switzer, Callin, Tarkowski, Leszek, Tavares, Hugo, Teal, Tracy, Theobold, Allison, Tirok, Katrin, Tylén, Kristian, Vanichkina, Darya, Voter, Carolyn, Webster, Tara, Weisner, Michael, White, Ethan P, Wilson, Earle, Woo, Kara, Wright, April, Yanco, Scott, Ye, Hao

Data Analysis and Visualization in Python for Ecologists

(View Complete Item Description)

Python is a general purpose programming language that is useful for writing scripts to work effectively and reproducibly with data. This is an introduction to Python designed for participants with no programming experience. These lessons can be taught in one and a half days (~ 10 hours). They start with some basic information about Python syntax, the Jupyter notebook interface, and move through how to import CSV files, using the pandas package to work with data frames, how to calculate summary information from a data frame, and a brief introduction to plotting. The last lesson demonstrates how to work with databases directly from Python.

Material Type: Module

Authors: Maxim Belkin, Tania Allard

Intro to R and RStudio for Genomics

(View Complete Item Description)

Welcome to R! Working with a programming language (especially if it’s your first time) often feels intimidating, but the rewards outweigh any frustrations. An important secret of coding is that even experienced programmers find it difficult and frustrating at times – so if even the best feel that way, why let intimidation stop you? Given time and practice* you will soon find it easier and easier to accomplish what you want. Why learn to code? Bioinformatics – like biology – is messy. Different organisms, different systems, different conditions, all behave differently. Experiments at the bench require a variety of approaches – from tested protocols to trial-and-error. Bioinformatics is also an experimental science, otherwise we could use the same software and same parameters for every genome assembly. Learning to code opens up the full possibilities of computing, especially given that most bioinformatics tools exist only at the command line. Think of it this way: if you could only do molecular biology using a kit, you could probably accomplish a fair amount. However, if you don’t understand the biochemistry of the kit, how would you troubleshoot? How would you do experiments for which there are no kits? R is one of the most widely-used and powerful programming languages in bioinformatics. R especially shines where a variety of statistical tools are required (e.g. RNA-Seq, population genomics, etc.) and in the generation of publication-quality graphs and figures. Rather than get into an R vs. Python debate (both are useful), keep in mind that many of the concepts you will learn apply to Python and other programming languages. Finally, we won’t lie; R is not the easiest-to-learn programming language ever created. So, don’t get discouraged! The truth is that even with the modest amount of R we will cover today, you can start using some sophisticated R software packages, and have a general sense of how to interpret an R script. Get through these lessons, and you are on your way to being an accomplished R user! * We very intentionally used the word practice. One of the other “secrets” of programming is that you can only learn so much by reading about it. Do the exercises in class, re-do them on your own, and then work on your own problems.

Material Type: Module

Authors: Ahmed Moustafa, Alexia Cardona, Andrea Ortiz, Jason Williams, Krzysztof Poterlowicz, Naupaka Zimmerman, Yuka Takemon

Data Analysis and Visualization with Python for Social Scientists

(View Complete Item Description)

Python is a general purpose programming language that is useful for writing scripts to work effectively and reproducibly with data. This is an introduction to Python designed for participants with no programming experience. These lessons can be taught in a day (~ 6 hours). They start with some basic information about Python syntax, the Jupyter notebook interface, and move through how to import CSV files, using the pandas package to work with data frames, how to calculate summary information from a data frame, and a brief introduction to plotting. The last lesson demonstrates how to work with databases directly from Python.

Material Type: Module

Authors: Geoffrey Boushey, Stephen Childs

Data Management with SQL for Social Scientists

(View Complete Item Description)

This is an alpha lesson to teach Data Management with SQL for Social Scientists, We welcome and criticism, or error; and will take your feedback into account to improve both the presentation and the content. Databases are useful for both storing and using data effectively. Using a relational database serves several purposes. It keeps your data separate from your analysis. This means there’s no risk of accidentally changing data when you analyze it. If we get new data we can rerun a query to find all the data that meets certain criteria. It’s fast, even for large amounts of data. It improves quality control of data entry (type constraints and use of forms in Access, Filemaker, etc.) The concepts of relational database querying are core to understanding how to do similar things using programming languages such as R or Python. This lesson will teach you what relational databases are, how you can load data into them and how you can query databases to extract just the information that you need.

Material Type: Module

Author: Peter Smyth

Geospatial Workshop Overview

(View Complete Item Description)

Data Carpentry’s aim is to teach researchers basic concepts, skills, and tools for working with data so that they can get more done in less time, and with less pain. Interested in teaching these materials? We have an onboarding video available to prepare Instructors to teach these lessons. After watching this video, please contact team@carpentries.org so that we can record your status as an onboarded Instructor. Instructors who have completed onboarding will be given priority status for teaching at centrally-organized Data Carpentry Geospatial workshops.

Material Type: Module

Authors: Anne Fouilloux, Arthur Endsley, Chris Prener, Jeff Hollister, Joseph Stachelek, Leah Wasser, Michael Sumner, Michele Tobias, Stace Maples

Image Processing with Python

(View Complete Item Description)

This lesson shows how to use Python and skimage to do basic image processing. With support from an NSF iUSE grant, Dr. Tessa Durham Brooks and Dr. Mark Meysenburg at Doane College, Nebraska, USA have developed a curriculum for teaching image processing in Python. This lesson is currently being piloted at different institutions. This pilot phase will be followed by a clean-up phase to incorporate suggestions and feedback from the pilots into the lessons and to make the lessons teachable by the broader community. Development for these lessons has been supported by a grant from the Sloan Foundation.

Material Type: Module

Author: Mark Meysenberg