This activity engages students in learning about ways to become energy efficient …
This activity engages students in learning about ways to become energy efficient consumers. Students examine how different countries and regions around the world use energy over time, as reflected in night light levels. They then track their own energy use, identify ways to reduce their individual energy consumption, and explore how community choices impact the carbon footprint.
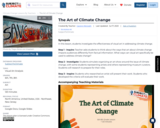
SYNOPSIS: In this lesson, students investigate the effectiveness of visual art in …
SYNOPSIS: In this lesson, students investigate the effectiveness of visual art in addressing climate change.
SCIENTIST NOTES: Simply put, not everyone is swayed by a scientific expert. Often it takes other means to convey a message to someone. That is why is an integral part of climate change communication. Art, scientifically, has a different impact on our thoughts and decision-making than hearing a lecture from an expert. This lesson explores different climate change art projects and shows their potential to reach audiences. This lesson has passed the scientific review process.
POSITIVES: -Students learn that art can be used to address issues that are usually just discussed in scientific terms. -Students learn about a variety of artists whose work deals with climate change. -Students can begin to visualize ways that they might make art about climate change, which can serve as a subsequent lesson. -This lesson is interactive and simulates a real-world situation in the art world, requiring a variety of skills.
ADDITIONAL PREREQUISITES: -This lesson can be paired with or follow a more in-depth discussion of climate change science. -Students should know how to use Google Slides or a similar type of presentation format. -Students should have a basic familiarity with rubrics.
DIFFERENTIATION: -Teachers can provide instruction multimodally. -Teachers can preview vocabulary with ESL students. -Teachers can follow up with questions to ensure comprehension. -Teachers can pair students with helpful peers. -It can be beneficial for developing students’ interpersonal skills if groups were randomized.
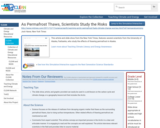
This article and slide show from the New York Times, features several …
This article and slide show from the New York Times, features several scientists from the University of Alaska, Fairbanks, who study the effects of thawing permafrost in Alaska.
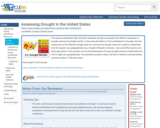
This easy-to-understand video animation describes drought and explains the different categories of …
This easy-to-understand video animation describes drought and explains the different categories of drought used by the drought monitor. It discusses the effects of and contributions to drought, what the implications of the different drought levels are, and puts the drought maps into context to understand how the impacts vary geographically (e.g. drought in Nevada vs Kansas - one could affect tourism, the other agriculture). It also touches on how the development of maps/drought severity is determined and how it might vary geographically. The animation provides a basic overview of statistics and percentiles and the concept of '100 year events.'
In this activity, students explore the web-based U.S. Forest Service Climate Change …
In this activity, students explore the web-based U.S. Forest Service Climate Change Atlas to learn about projected climate changes in their state and how suitable habitat for tree and bird species is projected to change by 2100.
These graphs show carbon dioxide measurements at the Mauna Loa Observatory, Hawaii. …
These graphs show carbon dioxide measurements at the Mauna Loa Observatory, Hawaii. The graphs display recent measurements as well as historical long term measurements. The related website summarizes in graphs the recent monthly CO2, the full CO2 Record, the annual Mean CO2 Growth Rate, and gives links to detailed CO2 data for this location, which is one of the most important CO2 tracking sites in the world.
This is a figure from the 2007 IPCC Assessment Report 4 on …
This is a figure from the 2007 IPCC Assessment Report 4 on atmospheric concentrations of carbon dioxide, methane and nitrous oxide over the last 10,000 years (large panels) and since 1750 (inset panels).
This is a photo essay linked to a New York Times story …
This is a photo essay linked to a New York Times story about climate-related stressors on forests -- including mountain pine beetles, forest fires, forest clearance, and ice storms -- and the importance of protecting forests as an important carbon sink.
This video shows where and how ice cores are extracted from the …
This video shows where and how ice cores are extracted from the West Antarctic Ice Sheet. The cores are cut, packaged, flown to the ice core storage facility in Denver, further sliced into samples, and shipped to labs all over the world where scientists use them to study indicators of climate change from the past.
This is a laboratory activity in which students will compare the amount …
This is a laboratory activity in which students will compare the amount of carbon dioxide in four different sources of gas and determine the carbon dioxide contribution from automobiles. They test ambient air, human exhalation, automobile exhaust, and nearly pure carbon dioxide from a vinegar/baking soda mixture.
In this video, NOAA's Deke Arndt, Chief of the Climate Monitoring Branch …
In this video, NOAA's Deke Arndt, Chief of the Climate Monitoring Branch at the National Climatic Data Center, recaps the temperature and precipitation data for the continental US in summer 2012. It describes how these conditions have led to drought and reduced crop yields.
This learning activity explores the concept of resiliency. It allows students to …
This learning activity explores the concept of resiliency. It allows students to make city planning decisions and then employs a game to test their resilience decisions against potential impacts from severe weather, climate change, and natural hazards.
This interactive shows the extent of the killing of lodgepole pine trees …
This interactive shows the extent of the killing of lodgepole pine trees in western Canada. The spread of pine beetle throughout British Columbia has devastated the lodgepole pine forests there. This animation shows the spread of the beetle and the increasing numbers of trees affected from 1999-2008 and predicts the spread up until 2015.
Learners research the effects of melting sea ice in the Bering Sea …
Learners research the effects of melting sea ice in the Bering Sea Ecosystem. They create research proposals to earn a place on the scientific research vessel Healy and present their findings and proposals to a Research Board committee.
The pandemic has highlighted major inequalities that existed before, in the "normal.” …
The pandemic has highlighted major inequalities that existed before, in the "normal.” In the news, there is talk of a return to "normal", but for many in marginalized communities"normal" was not justice. This project outlines three areas of local and global opportunity in our community: education, racial equity, and climate change.Through investigation, students will examine multiple perspectives, ask critical questions, analyze information, and act on what they learn. Their project is not only about the end product, but also the process.
In this activity, students conduct an energy audit to determine how much …
In this activity, students conduct an energy audit to determine how much carbon dioxide their family is releasing into the atmosphere and then make recommendations for minimizing their family's carbon footprint.
This is a collection of five short videos that show how climate …
This is a collection of five short videos that show how climate change is affecting fishing, native populations and access for the oil and gas industry in the Arctic. The videos include personal reflections by writers Andrew C. Revkin and Simon Romero, scientists, and residents about their experience of the impacts of the climate change in the Arctic.
This set of interactive data visualizations show the weather and climate events …
This set of interactive data visualizations show the weather and climate events that have had the greatest economic impact on the US from 1980 to 2016.
In this activity, students construct "flying birds" (pollution collectors) from paper and …
In this activity, students construct "flying birds" (pollution collectors) from paper and wire hangers. Students hang up their birds to see how they react to air pollution, and compare and make observations about the differences in the birds.
In this activity, students distinguish between directly and indirectly transmitted diseases and …
In this activity, students distinguish between directly and indirectly transmitted diseases and participate in a group game to simulate the spread of vector-borne diseases. They then research a particular pathogenic disease to learn how global warming and biodiversity loss can affect disease transmission.
No restrictions on your remixing, redistributing, or making derivative works. Give credit to the author, as required.
Your remixing, redistributing, or making derivatives works comes with some restrictions, including how it is shared.
Your redistributing comes with some restrictions. Do not remix or make derivative works.
Most restrictive license type. Prohibits most uses, sharing, and any changes.
Copyrighted materials, available under Fair Use and the TEACH Act for US-based educators, or other custom arrangements. Go to the resource provider to see their individual restrictions.