This webinar outlines how to use the free Open Science Framework (OSF) …
This webinar outlines how to use the free Open Science Framework (OSF) as an Electronic Lab Notebook for personal work or private collaborations. Fundamental features we cover include how to record daily activity, how to store images or arbitrary data files, how to invite collaborators, how to view old versions of files, and how to connect all this usage to more complex structures that support the full work of a lab across multiple projects and experiments.
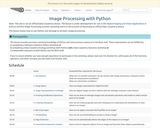
This lesson shows how to use Python and skimage to do basic …
This lesson shows how to use Python and skimage to do basic image processing. With support from an NSF iUSE grant, Dr. Tessa Durham Brooks and Dr. Mark Meysenburg at Doane College, Nebraska, USA have developed a curriculum for teaching image processing in Python. This lesson is currently being piloted at different institutions. This pilot phase will be followed by a clean-up phase to incorporate suggestions and feedback from the pilots into the lessons and to make the lessons teachable by the broader community. Development for these lessons has been supported by a grant from the Sloan Foundation.
Limiting the debilitating consequences of ageing is a major medical challenge of …
Limiting the debilitating consequences of ageing is a major medical challenge of our time. Robust pharmacological interventions that promote healthy ageing across diverse genetic backgrounds may engage conserved longevity pathways. Here we report results from the Caenorhabditis Intervention Testing Program in assessing longevity variation across 22 Caenorhabditis strains spanning 3 species, using multiple replicates collected across three independent laboratories. Reproducibility between test sites is high, whereas individual trial reproducibility is relatively low. Of ten pro-longevity chemicals tested, six significantly extend lifespan in at least one strain. Three reported dietary restriction mimetics are mainly effective across C. elegans strains, indicating species and strain-specific responses. In contrast, the amyloid dye ThioflavinT is both potent and robust across the strains. Our results highlight promising pharmacological leads and demonstrate the importance of assessing lifespans of discrete cohorts across repeat studies to capture biological variation in the search for reproducible ageing interventions.
Data Carpentry lesson to learn how to work with Amazon AWS cloud …
Data Carpentry lesson to learn how to work with Amazon AWS cloud computing and how to transfer data between your local computer and cloud resources. The cloud is a fancy name for the huge network of computers that host your favorite websites, stream movies, and shop online, but you can also harness all of that computing power for running analyses that would take days, weeks or even years on your local computer. In this lesson, you’ll learn about renting cloud services that fit your analytic needs, and how to interact with one of those services (AWS) via the command line.
Data Carpentry lesson to understand data structures and common storage and transfer …
Data Carpentry lesson to understand data structures and common storage and transfer formats for spatial data. The goal of this lesson is to provide an introduction to core geospatial data concepts. It is intended for learners who have no prior experience working with geospatial data, and as a pre-requisite for the R for Raster and Vector Data lesson . This lesson can be taught in approximately 75 minutes and covers the following topics: Introduction to raster and vector data format and attributes Examples of data types commonly stored in raster vs vector format Introduction to categorical vs continuous raster data and multi-layer rasters Introduction to the file types and R packages used in the remainder of this workshop Introduction to coordinate reference systems and the PROJ4 format Overview of commonly used programs and applications for working with geospatial data The Introduction to R for Geospatial Data lesson provides an introduction to the R programming language while the R for Raster and Vector Data lesson provides a more in-depth introduction to visualization (focusing on geospatial data), and working with data structures unique to geospatial data. The R for Raster and Vector Data lesson assumes that learners are already familiar with both geospatial data concepts and the core concepts of the R language.
Data Carpentry lesson to open, work with, and plot vector and raster-format …
Data Carpentry lesson to open, work with, and plot vector and raster-format spatial data in R. The episodes in this lesson cover how to open, work with, and plot vector and raster-format spatial data in R. Additional topics include working with spatial metadata (extent and coordinate reference systems), reprojecting spatial data, and working with raster time series data.
This workshop introduces the basic concepts of Git version control. Whether you're …
This workshop introduces the basic concepts of Git version control. Whether you're new to version control or just need an explanation of Git and GitHub, this two hour tutorial will help you understand the concepts of distributed version control. Get to know basic Git concepts and GitHub workflows through step-by-step lessons. We'll even rewrite a bit of history, and touch on how to undo (almost) anything with Git. This is a class for users who are comfortable with a command-line interface.
This class is designed for first-time and longer-term users of Jupyter Notebooks, …
This class is designed for first-time and longer-term users of Jupyter Notebooks, a workspace for writing code. The class focuses on using Notebooks to facilitate sharing and publishing of script workflows. It aims to provide users with knowledge about shortcuts, plugins, and best practices for maximizing re-usability and shareability of Notebook contents.
This is a recording of a 45 minute introductory webinar on preprints. …
This is a recording of a 45 minute introductory webinar on preprints. With our guest speaker Philip Cohen, we’ll cover what preprints/postprints are, the benefits of preprints, and address some common concerns researcher may have. We’ll show how to determine whether you can post preprints/postprints, and also demonstrate how to use OSF preprints (https://osf.io/preprints/) to share preprints. The OSF is the flagship product of the Center for Open Science, a non-profit technology start-up dedicated to improving the alignment between scientific values and scientific practices. Learn more at cos.io and osf.io, or email contact@cos.io.
In this webinar, Doctors David Mellor (Center for Open Science) and Stavroula …
In this webinar, Doctors David Mellor (Center for Open Science) and Stavroula Kousta (Nature Human Behavior) discuss the Registered Reports publishing workflow and the benefits it may bring to funders of research. Dr. Mellor details the workflow and what it is intended to do, and Dr. Kousta discusses the lessons learned at Nature Human Behavior from their efforts to implement Registered Reports as a journal.
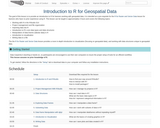
The goal of this lesson is to provide an introduction to R …
The goal of this lesson is to provide an introduction to R for learners working with geospatial data. It is intended as a pre-requisite for the R for Raster and Vector Data lesson for learners who have no prior experience using R. This lesson can be taught in approximately 4 hours and covers the following topics: Working with R in the RStudio GUI Project management and file organization Importing data into R Introduction to R’s core data types and data structures Manipulation of data frames (tabular data) in R Introduction to visualization Writing data to a file The the R for Raster and Vector Data lesson provides a more in-depth introduction to visualization (focusing on geospatial data), and working with data structures unique to geospatial data.
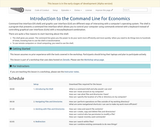
Command line interface (OS shell) and graphic user interface (GUI) are different …
Command line interface (OS shell) and graphic user interface (GUI) are different ways of interacting with a computer’s operating system. The shell is a program that presents a command line interface which allows you to control your computer using commands entered with a keyboard instead of controlling graphical user interfaces (GUIs) with a mouse/keyboard combination. There are quite a few reasons to start learning about the shell: The shell gives you power. The command line gives you the power to do your work more efficiently and more quickly. When you need to do things tens to hundreds of times, knowing how to use the shell is transformative. To use remote computers or cloud computing, you need to use the shell.
Data Carpentry lesson to learn to navigate your file system, create, copy, …
Data Carpentry lesson to learn to navigate your file system, create, copy, move, and remove files and directories, and automate repetitive tasks using scripts and wildcards with genomics data. Command line interface (OS shell) and graphic user interface (GUI) are different ways of interacting with a computer’s operating system. The shell is a program that presents a command line interface which allows you to control your computer using commands entered with a keyboard instead of controlling graphical user interfaces (GUIs) with a mouse/keyboard combination. There are quite a few reasons to start learning about the shell: For most bioinformatics tools, you have to use the shell. There is no graphical interface. If you want to work in metagenomics or genomics you’re going to need to use the shell. The shell gives you power. The command line gives you the power to do your work more efficiently and more quickly. When you need to do things tens to hundreds of times, knowing how to use the shell is transformative. To use remote computers or cloud computing, you need to use the shell.
This video will introduce how to calculate confidence intervals around effect sizes …
This video will introduce how to calculate confidence intervals around effect sizes using the MBESS package in R. All materials shown in the video, as well as content from our other videos, can be found here: https://osf.io/7gqsi/
Welcome to R! Working with a programming language (especially if it’s your …
Welcome to R! Working with a programming language (especially if it’s your first time) often feels intimidating, but the rewards outweigh any frustrations. An important secret of coding is that even experienced programmers find it difficult and frustrating at times – so if even the best feel that way, why let intimidation stop you? Given time and practice* you will soon find it easier and easier to accomplish what you want. Why learn to code? Bioinformatics – like biology – is messy. Different organisms, different systems, different conditions, all behave differently. Experiments at the bench require a variety of approaches – from tested protocols to trial-and-error. Bioinformatics is also an experimental science, otherwise we could use the same software and same parameters for every genome assembly. Learning to code opens up the full possibilities of computing, especially given that most bioinformatics tools exist only at the command line. Think of it this way: if you could only do molecular biology using a kit, you could probably accomplish a fair amount. However, if you don’t understand the biochemistry of the kit, how would you troubleshoot? How would you do experiments for which there are no kits? R is one of the most widely-used and powerful programming languages in bioinformatics. R especially shines where a variety of statistical tools are required (e.g. RNA-Seq, population genomics, etc.) and in the generation of publication-quality graphs and figures. Rather than get into an R vs. Python debate (both are useful), keep in mind that many of the concepts you will learn apply to Python and other programming languages. Finally, we won’t lie; R is not the easiest-to-learn programming language ever created. So, don’t get discouraged! The truth is that even with the modest amount of R we will cover today, you can start using some sophisticated R software packages, and have a general sense of how to interpret an R script. Get through these lessons, and you are on your way to being an accomplished R user! * We very intentionally used the word practice. One of the other “secrets” of programming is that you can only learn so much by reading about it. Do the exercises in class, re-do them on your own, and then work on your own problems.
The Java Tutorials are practical guides for programmers who want to use …
The Java Tutorials are practical guides for programmers who want to use the Java programming language to create applications. They include hundreds of complete, working examples, and dozens of lessons. Groups of related lessons are organized into "trails".
No restrictions on your remixing, redistributing, or making derivative works. Give credit to the author, as required.
Your remixing, redistributing, or making derivatives works comes with some restrictions, including how it is shared.
Your redistributing comes with some restrictions. Do not remix or make derivative works.
Most restrictive license type. Prohibits most uses, sharing, and any changes.
Copyrighted materials, available under Fair Use and the TEACH Act for US-based educators, or other custom arrangements. Go to the resource provider to see their individual restrictions.