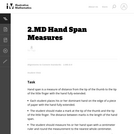
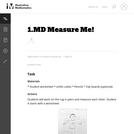
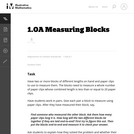
In this task students work with partners to measure themselves by laying …
In this task students work with partners to measure themselves by laying multiple copies of a shorter object that represents the length unit end to end. It gives students the opportunity to discuss the need to be careful when measuring.
Students will apply what they have learned in previous lessons to analyze …
Students will apply what they have learned in previous lessons to analyze and draw conclusions about a set of data. They will also justify their thinking based on what they know about the measures (e.g., I know the mean is a good number to use to describe what is typical because the range is narrow and so the MAD is low.).Students analyze one of the data sets about the characteristics of sixth grade students that was collected by the class in Lesson 2. Students construct line plots and calculate measures of center and spread in order to further their understanding of the characteristics of a typical sixth grade student.Key ConceptsNo new mathematical ideas are introduced in this lesson. Instead, students apply the skills they have acquired in previous lessons to analyze a data set for one attribute of a sixth grade student. Students make a line plot of the data and find the mean, median, range, MAD, and outliers. They use these results to determine a typical value for their data.Goals and Learning ObjectivesDescribe an attribute of a typical sixth grade student using line plots and measures of center (mean and median) and spread (range and MAD).Justify thinking about which measures are good descriptors of the data set.
Data Carpentry trains researchers in the core data skills for efficient, shareable, …
Data Carpentry trains researchers in the core data skills for efficient, shareable, and reproducible research practices. We run accessible, inclusive training workshops; teach openly available, high-quality, domain-tailored lessons; and foster an active, inclusive, diverse instructor community that promotes and models reproducible research as a community norm.
Relation of purpose of data to data requirements. Relation of data to …
Relation of purpose of data to data requirements. Relation of data to costs. Accuracy requirements of measurements and error propagation: Related to a problem the required accuracy of measurements and the consequences for accuracy in the final result are discussed. Different types of errors are handled. Propagation of errors; for dependent and independent measurements, from mathematical relations and regression is demonstrated. Recapitulated is the theory of regression and correlation. Interpretation of measurements, data completion: By standard statistical methods screening of measured data is performed; double mass analysis, residual mass, simple rainfall-runoff modelling. Detection of trends; split record tests, Spearman rank tests. Methods to fill data gaps and do filtering on data series for noise reduction. Methods of hydrological measurements and measuring equipment: To determine quantitatively the most important elements in the hydrological cycle an overview is presented of most common hydrological measurements, measuring equipment and indirect determination methods i.e. for precipitation, evaporation, transpiration, river discharge and groundwater tables. Use, purpose and measurement techniques for tracers in hydrology is discussed. Advantages and disadvantages and specific condition/application of methods are discussed. Equipment is demonstrated and discussed. Areal distributed observation: Areal interpolation techniques of point observations: inverse distance, Thiessen, contouring, Kriging. Comparison of interpolation techniques and estimation of errors. Correlation analysis of areal distributed observation of rainfall Design of measuring networks: Based on correlation characteristics from point measurements (e.g. rainfall stations) and accuracy requirements the design of a network of stations is demonstrated.
This 10-day module builds on Grade 2 concepts about data, graphing, and …
This 10-day module builds on Grade 2 concepts about data, graphing, and line plots. The two topics in this module focus on generating and analyzing categorical and measurement data. By the end of the module, students are working with a mixture of scaled picture graphs, bar graphs, and line plots to problem solve using both categorical and measurement data.
Find the rest of the EngageNY Mathematics resources at https://archive.org/details/engageny-mathematics.
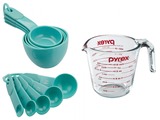
This lesson introduces students to measuring food ingredients, provides a lab opportunity …
This lesson introduces students to measuring food ingredients, provides a lab opportunity to experiment with measuring tools, and assesses students' knowledge on all content.
In this Cyberchase video segment, the CyberSquad must measure the length of …
In this Cyberchase video segment, the CyberSquad must measure the length of the rope that will lower Digit from the ceiling to remove the voice box from a statue of Hacker.
Students estimate the length of 50 seconds by starting an unseen timer …
Students estimate the length of 50 seconds by starting an unseen timer and stopping it when they think 50 seconds has elapsed. The third attempt is recorded and compiled into a data set, which students then compare to the third attempt from the previous lesson when they estimated the length of 20 seconds. Students analyze the data to make conclusions about how well seventh grade students can estimate lengths of time.Students repeat the timing activity for 50 seconds, but only the third trial is recorded. The task today is to compare this set of data with the third trial for 20 seconds. Students will need to deal with the difference in the spread of data, as well as how to compare the data sets. Students will be reminded of Mean Absolute Deviation (MAD), which will be a useful tool in this situation.Key ConceptsStudents apply the tools learned in Unit 6.8:Measures of center and spreadMean absolute deviation (MAD)Goals and Learning ObjectivesApply knowledge of statistics to compare different sets of data.Use measures of center and spread to analyze data.
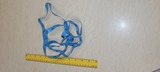
In this lesson the students will be able to demonstrate the ability …
In this lesson the students will be able to demonstrate the ability to use a variety of non-standard unit of measurements to measure the length of different objects around the outdoor classroom.
This lesson is set up as project based learning on how to …
This lesson is set up as project based learning on how to measure metal. Students will get first hand experience discovering foundational knowledge about tools that measure metal length width and thickness. Then they will get to practice measuring objects and metal.
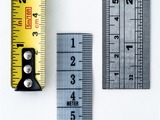
Aimed at statistics beginners, this learning object describes, and gives examples of, …
Aimed at statistics beginners, this learning object describes, and gives examples of, the four levels of measurement of data: nominal, ordinal, interval and ratio.
No restrictions on your remixing, redistributing, or making derivative works. Give credit to the author, as required.
Your remixing, redistributing, or making derivatives works comes with some restrictions, including how it is shared.
Your redistributing comes with some restrictions. Do not remix or make derivative works.
Most restrictive license type. Prohibits most uses, sharing, and any changes.
Copyrighted materials, available under Fair Use and the TEACH Act for US-based educators, or other custom arrangements. Go to the resource provider to see their individual restrictions.