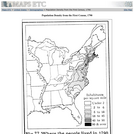
A map of the eastern United States in 1790 showing the western …
A map of the eastern United States in 1790 showing the western extent of the territories to the Mississippi, and the distribution of European–American population at the time. The map is keyed to show areas of population densities ranging from under 2 inhabitants per square mile to areas with 90 or more inhabitants per square mile.
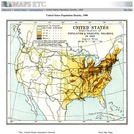
A map from 1912 of the United States, subtitled "Distribution of Population …
A map from 1912 of the United States, subtitled "Distribution of Population and Railways in 1900" showing the increase in population and expansion of the railroad network since 1850. The map is color–coded to show population densities ranging from areas with fewer than 2 inhabitants per square mile to areas of 90 or more inhabitants per square mile. Cities with populations over 8,000 are shown with circles proportionate to their populations at the time. The map shows the westward progression of the mean centers of population from 1790 to 1900.
No restrictions on your remixing, redistributing, or making derivative works. Give credit to the author, as required.
Your remixing, redistributing, or making derivatives works comes with some restrictions, including how it is shared.
Your redistributing comes with some restrictions. Do not remix or make derivative works.
Most restrictive license type. Prohibits most uses, sharing, and any changes.
Copyrighted materials, available under Fair Use and the TEACH Act for US-based educators, or other custom arrangements. Go to the resource provider to see their individual restrictions.