This course presents real-world examples in which quantitative methods provide a significant …
This course presents real-world examples in which quantitative methods provide a significant competitive edge that has led to a first order impact on some of today's most important companies. We outline the competitive landscape and present the key quantitative methods that created the edge (data-mining, dynamic optimization, simulation), and discuss their impact.
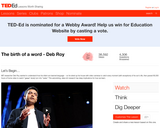
MIT researcher Deb Roy wanted to understand how his infant son learned …
MIT researcher Deb Roy wanted to understand how his infant son learned language -- so he wired up his house with videocameras to catch every moment (with exceptions) of his son's life, then parsed 90,000 hours of home video to watch "gaaaa" slowly turn into "water." Astonishing, data-rich research with deep implications for how we learn. Deb Roy studies how children learn language, and designs machines that learn to communicate in human-like ways. On sabbatical from MIT Media Lab, he's working with the AI company Bluefin Labs. A quiz, thought provoking question, and links for further study are provided to create a lesson around the 20-minute video. Educators may use the platform to easily "Flip" or create their own lesson for use with their students of any age or level.
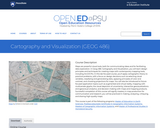
Maps capture the power of place. A well-designed map can stoke our …
Maps capture the power of place. A well-designed map can stoke our imagination, helping us to understand how a place looks or feels. Maps serve two roles. First, maps facilitate visual communication where knowns are presented to map readers. Second, maps permit visual thinking where insights into patterns and trends in spatial data are explored. In GEOG 486, Cartography & Visualization, you will learn and apply cartographic theory creating appropriately designed maps. You will learn how to associate the visual variables to symbolize types of spatial data. This process creates an appropriate visual hierarchy that conveys an informational hierarchy about the underlying message. Thus, techniques in map design will be applied to produce, evaluate, and critique reference and thematic maps.
Dashboards for data visualisation, such as R Shiny and Tableau, allow an …
Dashboards for data visualisation, such as R Shiny and Tableau, allow an interactive exploration of data by means of drop-down lists and checkboxes, with no coding for the user. The apps can be useful for both the data analyst and the public.
This course is offered during the Independent Activities Period (IAP), which is …
This course is offered during the Independent Activities Period (IAP), which is a special 4-week term at MIT that runs from the first week of January until the end of the month. This survey course is intended to review memory and its impact on our lives. Memories make us who we are, and make us what we are going to become. The loss of memory in amnesia can cause us to lose ourselves. Memory provides a bridge between past and present. Through memory, past sensations, feelings, and ideas that have dropped from conscious awareness can be subsequently recovered to guide current thought and action. In this manner, memory allows us to locate our car in the parking lot at the end of the day or guides us to avoid retelling the same joke to the same friend. This seminar will focus on how memories are created and controlled such that we are able to remember the past. Recent insights from non-human electrophysiological and human brain imaging research will be emphasized.
In EARTH 801, you will develop skills in a programming language designed …
In EARTH 801, you will develop skills in a programming language designed for visual arts and visualization while exploring Earth science topics. Specifically, you'll learn and practice digital graphics capabilities in order to render Earth science concepts that are otherwise difficult to visualize due to complicated space and time scales. Here, you will interact with large, open, freely-available data sets by collecting, plotting, and analyzing them using a variety of computational methods. You'll be ready to teach secondary school students a range of Next Generation Science Standard skills involving data collecting, manipulation, analysis, and plotting. You'll also read and discuss current research regarding the teaching, learning, and evaluation of visualization skills, as well as multiple external representations of science concepts.
Original data has become more accessible thanks to cultural and technological advances. …
Original data has become more accessible thanks to cultural and technological advances. On the internet, we can find innumerable data sets from sources such as scientific journals and repositories, local and national governments, and non-governmental organisations. Often, these data may be presented in novel ways, by creating new tables or plots, or by integrating additional data. Free, open-source software has become a great companion for open data. This open scholarship project offers free workshops and coding meet-ups (hackathons) to learn and practise data presentation, across the UK. It is made possible by a fellowship of the Software Sustainability Institute.
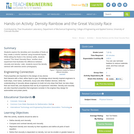
Students explore the densities and viscosities of fluids as they create a …
Students explore the densities and viscosities of fluids as they create a colorful 'rainbow' using household liquids. While letting the fluids in the rainbow settle, students conduct 'The Great Viscosity Race,' another short experiment that illustrates the difference between viscosity and density. Later, students record the density rainbow with sketches and/or photography.
This course explores the reciprocal relationships among design, science, and technology by …
This course explores the reciprocal relationships among design, science, and technology by covering a wide range of topics including industrial design, architecture, visualization and perception, design computation, material ecology, and environmental design and sustainability. Students will examine how transformations in science and technology have influenced design thinking and vice versa, as well as develop methodologies for design research and collaborate on design solutions to interdisciplinary problems.
Digitize Me, Visualize Me, Search Me takes as its starting point the …
Digitize Me, Visualize Me, Search Me takes as its starting point the so-called ‘computational turn’ to data-intensive scholarship in the humanities. What Digitize Me, Visualize Me, Search Me endeavours to show is that such data-focused transformations in research can be seen as part of a major alteration in the status and nature of knowledge. It is an alteration that, according to the philosopher Jean François Lyotard, has been taking place since at least the 1950s, and involves nothing less than a shift away from a concern with questions of what is right and just, and toward a concern with legitimating power by optimizing the social system’s performance in instrumental, functional terms. This shift has significant consequences for our idea of knowledge.
This workshop with Mario Trejo will cover how to use Inkscape tools to …
This workshop with Mario Trejo will cover how to use Inkscape tools to edit titles, legends, axes and highlight areas of a plot. This workshop is designed for individuals who frequently develop data visualizations using statistical software, but do not necessarily have the coding background to make extensive edits. The workshop will focus on editing output graphics from R and SAS statistical software.
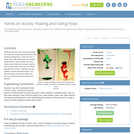
Students discover fluid dynamics related to buoyancy through experimentation and optional photography. …
Students discover fluid dynamics related to buoyancy through experimentation and optional photography. Using one set of fluids, they make light fluids rise through denser fluids. Using another set, they make dense fluids sink through a lighter fluid. In both cases, they see and record beautiful fluid motion. Activities are also suitable as class demonstrations. The natural beauty of fluid flow opens the door to seeing the beauty of physics in general.
This is a foundation subject in modern software development techniques for engineering …
This is a foundation subject in modern software development techniques for engineering and information technology. The design and development of component-based software (using C# and .NET) is covered; data structures and algorithms for modeling, analysis, and visualization; basic problem-solving techniques; web services; and the management and maintenance of software. Includes a treatment of topics such as sorting and searching algorithms; and numerical simulation techniques. Foundation for in-depth exploration of image processing, computational geometry, finite element methods, network methods and e-business applications. This course is a core requirement for the Information Technology M. Eng. program. This class was also offered in Course 13 (Department of Ocean Engineering) as 13.470J. In 2005, ocean engineering subjects became part of Course 2 (Department of Mechanical Engineering), and the 13.470J designation was dropped in lieu of 2.159J.
This course is an introduction to data cleaning, analysis and visualization. We …
This course is an introduction to data cleaning, analysis and visualization. We will teach the basics of data analysis through concrete examples. You will learn how to take raw data, extract meaningful information, use statistical tools, and make visualizations. This was offered as a non-credit course during the Independent Activities Period (IAP), which is a special 4-week term at MIT that runs from the first week of January until the end of the month.
When a flood is forecast for the Red River of the North, …
When a flood is forecast for the Red River of the North, community leaders, emergency responders, and residents around Fargo, North Dakota, and Moorhead, Minnesota, can gauge their need for preparation by accessing visualizations showing the extent, depth, and timing of expected flooding.
This course explores audio synthesis, musical structure, human computer interaction (HCI), and …
This course explores audio synthesis, musical structure, human computer interaction (HCI), and visual presentation for the creation of interactive musical experiences. Topics include audio synthesis; mixing and looping; MIDI sequencing; generative composition; motion sensors; music games; and graphics for UI, visualization, and aesthetics. Weekly programming assignments in python are included. Student teams build an original, dynamic, and engaging interactive music system for their final project.
This workshop is designed to introduce students to different perspectives on politics …
This workshop is designed to introduce students to different perspectives on politics and the state of the world through new visualization techniques and approaches to interactive political gaming (and selective 'edutainment'). Specifically, we shall explore applications of interactive tools (such as video and web-based games, blogs or simulations) to examine critical challenges in international politics of the 21C century focusing specifically on general insights and specific understandings generated by operational uses of core concepts in political science.
This is an accelerated introduction to MATLAB® and its popular toolboxes. Lectures …
This is an accelerated introduction to MATLAB® and its popular toolboxes. Lectures are interactive, with students conducting sample MATLAB problems in real time. The course includes problem-based MATLAB assignments. Students must provide their own laptop and software. This is great preparation for classes that use MATLAB.
No restrictions on your remixing, redistributing, or making derivative works. Give credit to the author, as required.
Your remixing, redistributing, or making derivatives works comes with some restrictions, including how it is shared.
Your redistributing comes with some restrictions. Do not remix or make derivative works.
Most restrictive license type. Prohibits most uses, sharing, and any changes.
Copyrighted materials, available under Fair Use and the TEACH Act for US-based educators, or other custom arrangements. Go to the resource provider to see their individual restrictions.