In this model eliciting activity (MEA), students are hired by a travel …
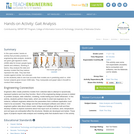
In this model eliciting activity (MEA), students are hired by a travel magazine to determine if two airlines that fly into Chicago are equally reliable. They examine data of flight arrival delay times for both airlines flying out of the same city. They first identify measures that can be used to compare the two airlines. Working in small groups, the students decide the size of a meaningful difference between the airlines for each measure and use that information to determine a rule that for deciding if one airline is more reliable than another. The students apply their rule to flight arrival delay data for the two airlines from four additional departure cities, and use the results to write a report to the magazine editor on whether or not one airline is more reliable than the other. This activity can serve as an introduction to ideas of central tendency and variability, and prepares students for formal approaches to comparing groups.
In this open-ended, hands-on activity that provides practice in engineering data analysis, …
In this open-ended, hands-on activity that provides practice in engineering data analysis, students are given gait signature metric (GSM) data for known people types (adults and children). Working in teams, they analyze the data and develop models that they believe represent the data. They test their models against similar, but unknown (to the students) data to see how accurate their models are in predicting adult vs. child human subjects given known GSM data. They manipulate and graph data in Excel® to conduct their analyses.
Gait analysis is the study of human motion that can be utilized …
Gait analysis is the study of human motion that can be utilized as biometric information or identification, for medical diagnostics or for comparative biomechanics. In this activity, students observe walking human subjects and then discuss parameters that could be used to characterize walking gaits. They use accelerometers to collect and graph acceleration vs. time data that can help in gait analysisâall part of practicing the engineering data analysis process. Students complete this activity before learning the material presented in the associated lesson.
This model-eliciting activity (MEA) challenges students to develop a model for predicting …
This model-eliciting activity (MEA) challenges students to develop a model for predicting the characteristics of a person who has committed a crime. Students work with real data on shoe length, height, and gender to develop the model. Students write a report to the crime victim that identifies a suspect and justifies their decision. The activity sets the stage for students to learn about regression models, and reinforces their understanding of central tendency and variability. It is suggested that this activity be used prior to a formal introduction to linear relationships.
This model-eliciting activity (MEA) challenges students to develop ideas about center and …
This model-eliciting activity (MEA) challenges students to develop ideas about center and variability when making decisions based on data. Students examine data on departure delays for five airlines flying out of the Chicago O'Hare airport. The task is to develop a model to determine which airline has the best chance of departing on time. Students write a report that identifies the best airline and the reasoning behind their decision.
This model-eliciting activity has students determine how to create a fair judging …
This model-eliciting activity has students determine how to create a fair judging scheme for a paper airplane contest while considering both the most accurate paper airplane and the best floater. Students are given a sample of data that includes multiple flights of paper airplanes by three different pilots. Each team writes a report describing how their judging scheme can be implemented by the judges of the contest. This activity could serve as an introduction to ideas of central tendency and variability. It can also set the stage for understanding the correspondence between data sets and their graphical representations. Alternatively, the activity could be the basis for student introduction to analysis of variance.
Distributions and Variability Type of Unit: Project Prior Knowledge Students should be …
Distributions and Variability
Type of Unit: Project
Prior Knowledge
Students should be able to:
Represent and interpret data using a line plot. Understand other visual representations of data.
Lesson Flow
Students begin the unit by discussing what constitutes a statistical question. In order to answer statistical questions, data must be gathered in a consistent and accurate manner and then analyzed using appropriate tools.
Students learn different tools for analyzing data, including:
Measures of center: mean (average), median, mode Measures of spread: mean absolute deviation, lower and upper extremes, lower and upper quartile, interquartile range Visual representations: line plot, box plot, histogram
These tools are compared and contrasted to better understand the benefits and limitations of each. Analyzing different data sets using these tools will develop an understanding for which ones are the most appropriate to interpret the given data.
To demonstrate their understanding of the concepts, students will work on a project for the duration of the unit. The project will involve identifying an appropriate statistical question, collecting data, analyzing data, and presenting the results. It will serve as the final assessment.
Students write statistical questions that can be used to find information about …
Students write statistical questions that can be used to find information about a typical sixth grade student. Then, the class works together to informally plan how to find the typical arm span of a student in their class.Key ConceptsStatistical thinking, in large part, must deal with variability; statistical problem solving and decision making depend on understanding, explaining, and quantifying the variability in the data.“How tall is a sixth grader?” is a statistical question because all sixth graders are not the same height—there is variability.Goals and Learning ObjectivesUnderstand what a statistical question is.Realize there is variability in data and understand why.Describe informally the range, median, and mode of a set of data.
This course develops logical, empirically based arguments using statistical techniques and analytic …
This course develops logical, empirically based arguments using statistical techniques and analytic methods. Elementary statistics, probability, and other types of quantitative reasoning useful for description, estimation, comparison, and explanation are covered. Emphasis is on the use and limitations of analytical techniques in planning practice.
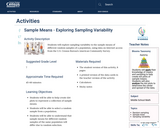
Students will explore sampling variability in the sample means of different random …
Students will explore sampling variability in the sample means of different random samples of a population, using data on Internet access from the U.S. Census Bureau’s American Community Survey.
After students have complete the associated activity to collect and graph acceleration …
After students have complete the associated activity to collect and graph acceleration data from walking human subjects, they learn more about gait analysis---the study of human motion, which is used as biometric data for human medical diagnostics and (non-human) comparative biomechanics. They learn about the steps that comprise the universal process of engineering analysisâdata collection, data analysis, mathematical modeling and reportingâand consider how these steps could be applied to analyze a person's gait, which prepares them to conduct the second associated activity.
No restrictions on your remixing, redistributing, or making derivative works. Give credit to the author, as required.
Your remixing, redistributing, or making derivatives works comes with some restrictions, including how it is shared.
Your redistributing comes with some restrictions. Do not remix or make derivative works.
Most restrictive license type. Prohibits most uses, sharing, and any changes.
Copyrighted materials, available under Fair Use and the TEACH Act for US-based educators, or other custom arrangements. Go to the resource provider to see their individual restrictions.